
10-year yield and mortgage rates
In my 2025 forecast, I anticipated the following ranges:
- Mortgage rates between 5.75% and 7.25%
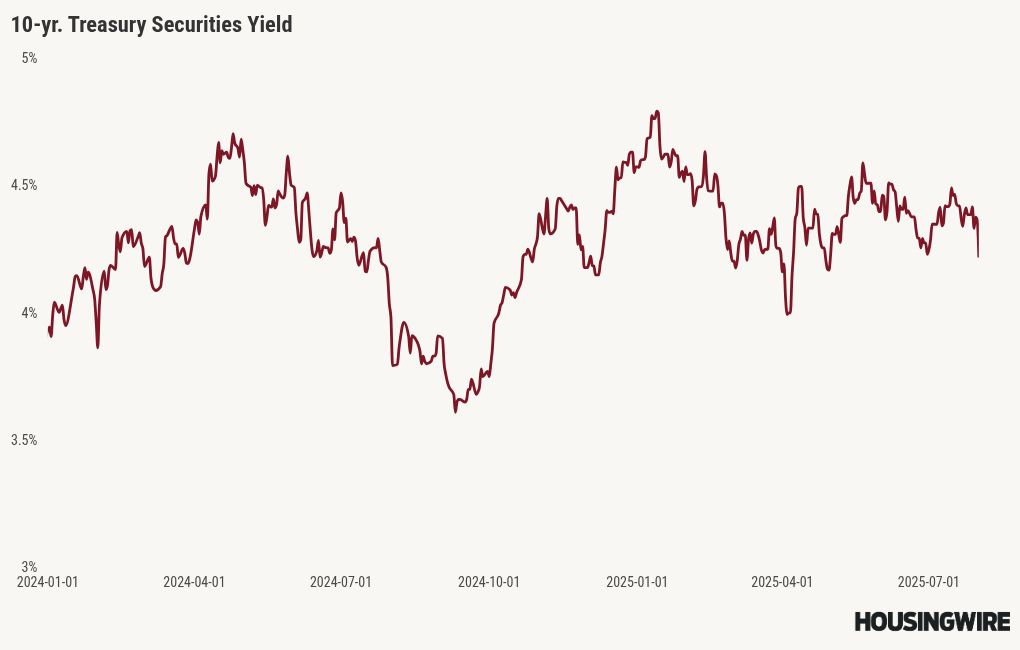
- The 10-year yield fluctuates between 3.80% and 4.70%
The 10-year yield has fluctuated between approximately 4.79% and 3.87% this year, considering overnight trading within that range. Meanwhile, mortgage rates have varied from 7.25% to 6.50%. So, what comes next? If the labor data gets weaker, then the 10-year yield can head toward 3.80% with mortgage rates heading near 6% for sure, but we need more weakness in economic data or a more dovish Fed.
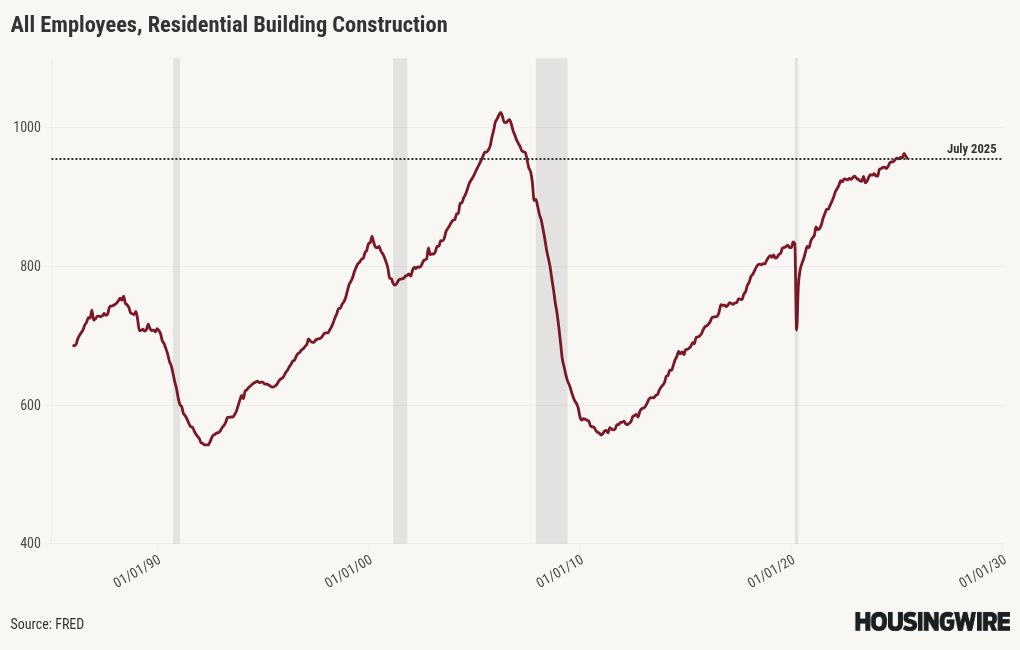
In a special weekend episode of the HousingWire Daily podcast, I discuss my perspective on the labor data, which has been declining for 19 months but hasn’t yet reached a breaking point. The key difference between this year and the previous years is that one of my two labor indicators is signaling a full-blown recession. Typically, we see residential construction workers losing jobs before a recession hits. Since 2010, there have been instances where this data fell for three to four consecutive months without resulting in a recession, but the current situation is different.
We’re seeing completed housing units at historically high levels, which suggests that the decline in labor can pick up if demand gets worse. We need to monitor this situation closely moving forward.
The 10-year yield action was all on Friday. We had a waterfall drop from a high of 4.40% down to 4.21%. Mortgage rates fell 12 basis points on Friday to 6.63% and for the week, 18 basis points.
Mortgage spreads
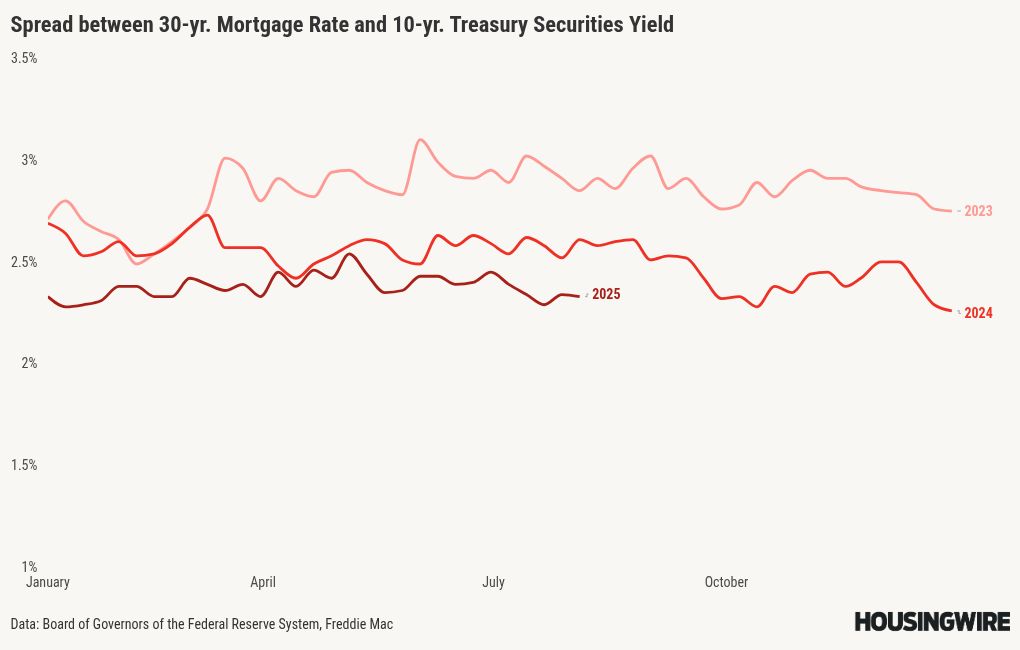
The improvement in mortgage spreads in 2025 has been a blessing for housing, as demand could have been worse if mortgage spreads hadn’t improved since the worst levels of 2023. With more rate cuts and a dovish tone from the Fed, the spreads can slowly improve over time. I was looking for a 0.27%-0.41% improvement in 2025, working from a 2.54% average in 2024. So far, we haven’t hit that level, but we’ve gotten close.
If the spreads were as bad as they were at the peak of 2023, mortgage rates would currently be 0.77 % higher. Conversely, if the spreads returned to their normal range, mortgage rates would be 0.53%-0.73% lower than today’s level. Historically, mortgage spreads have ranged between 1.60% and 1.80%.
The best levels of normal spreads would mean mortgage rates at 5.90% % to 6.10% today, a notable difference.
Purchase application data
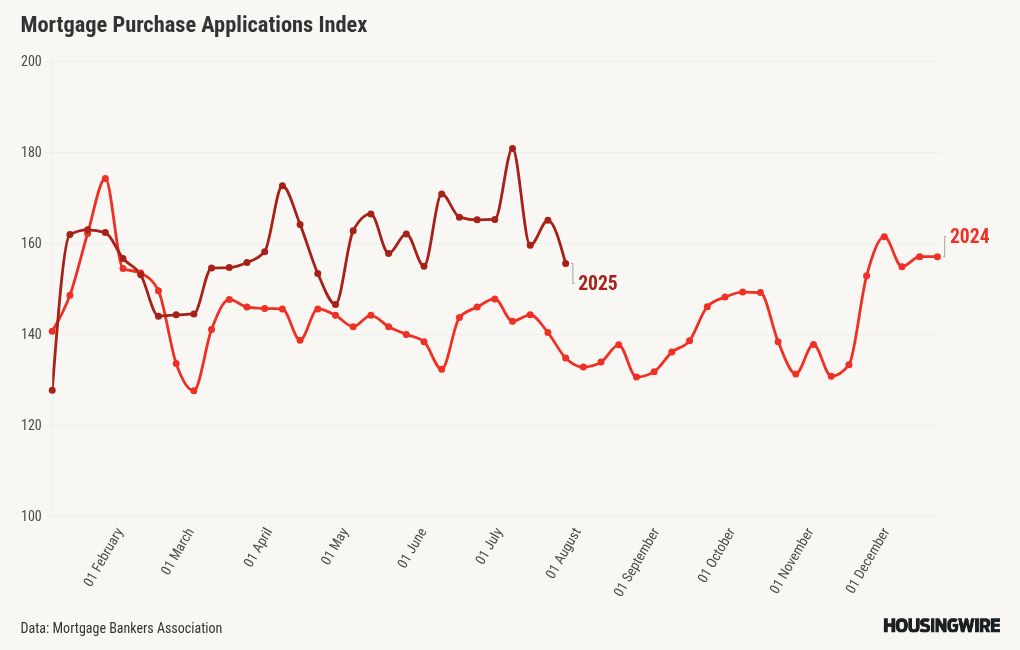
Last week, the purchase application data showed a 6% week-to-week decline and a 17% year-over-year gain. The year-over-year growth in new listings can help explain the growth we have had in the year-over-year data for purchase apps. Now that mortgage rates are below 6.64%, if they continue to fall, we should see better week-to-week data, as we have seen in the past.
Here is the weekly data for 2025:
- 13 positive readings
- 11 negative readings
- 5 flat prints
- 26 straight weeks of positive year-over-year data
- 13 consecutive weeks of double-digit growth year over year
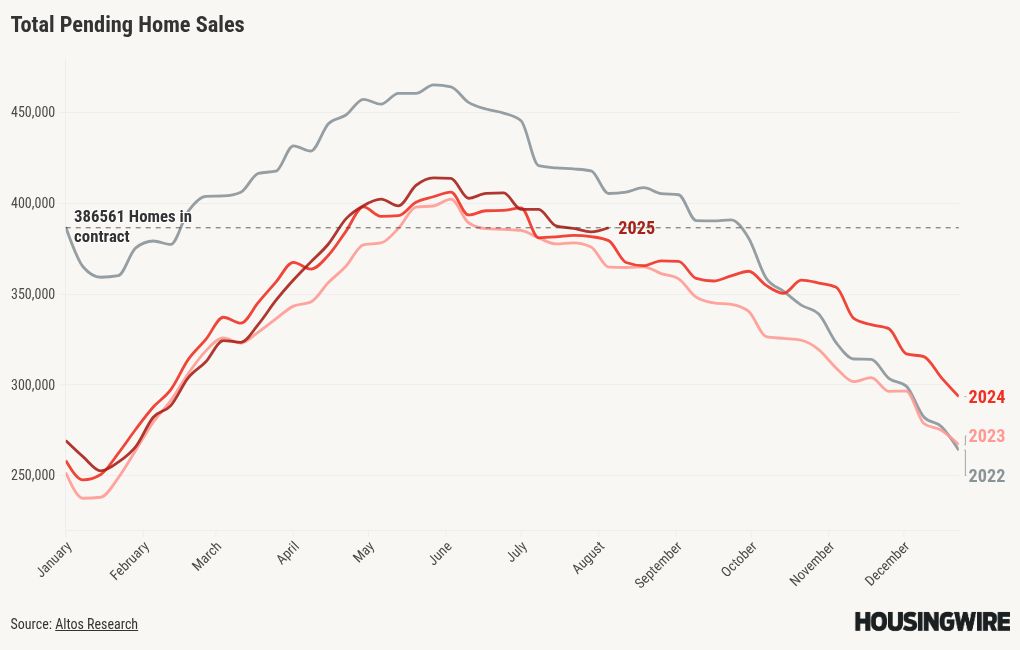
Total pending sales
The latest total pending sales data from Altos provides valuable insights into current trends in housing demand. Last year, we observed a significant shift when mortgage rates decreased from 6.64% to around 6% Now that mortgage rates are at 6.63%, it will be interesting to see what happens with the data if we can get rates heading toward 6% with duration.
Total pending sales:
- 2025: 386561
- 2024: 379,478
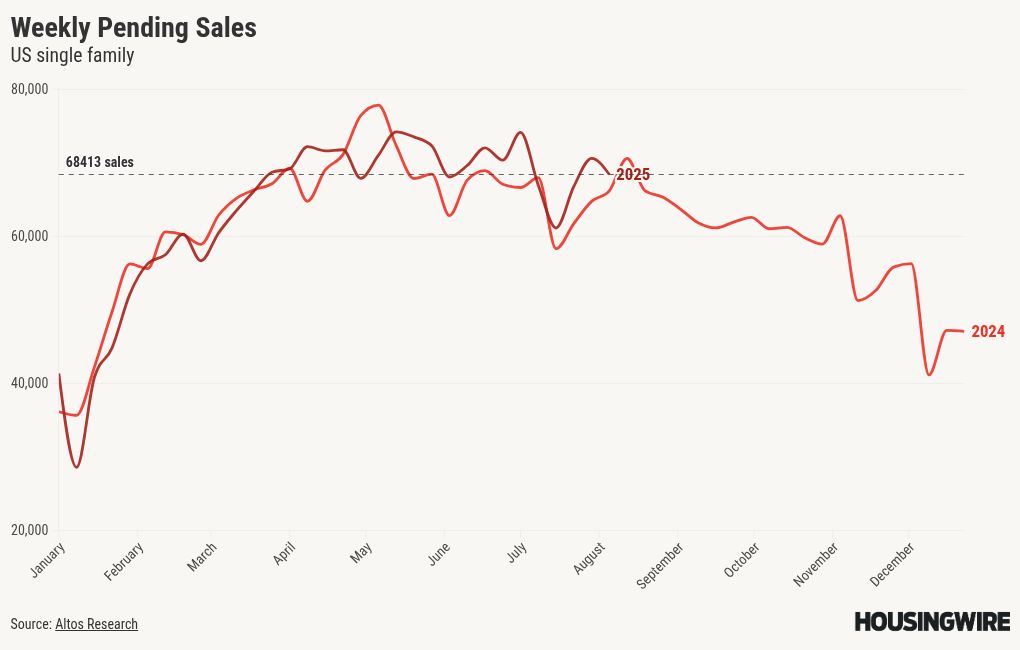
Weekly pending sales
Our weekly pending home sales provide a week-to-week glimpse into the data; however, this data line can also be impacted by holidays and any short-term shocks. We did see a week-to-week decline in this data line, while still showing year-over-year growth
Weekly pending sales for last week:
- 2025: 68,413
- 2024: 66,197
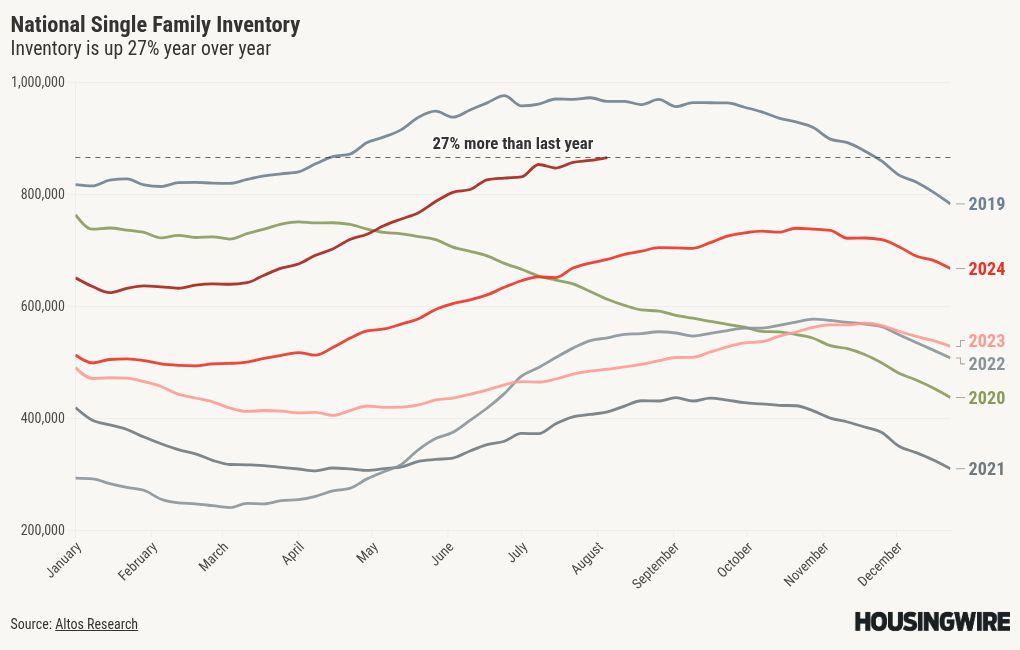
Weekly housing inventory data
One of the recent themes we have had with the Housing Market Tracker articles is that the growth rate of inventory is slowing, and this started toward the end of June. Once I got the 2-week July 4th holiday out of the data, this trend has continued this week, but I will be curious to see how the tracker looks if mortgage rates head toward 6%, especially with duration.
Still, the best story for housing in 2024 and 2025 has been the inventory growth and cooling down in home-price growth.
Last week, inventory growth slowed from the previous week’s growth rate.
- Weekly inventory change (July 25-Aug. 1): Inventory rose from 860,426 to 865,620
- The same week last year (July 26-Aug. 2): Inventory rose from 677,246 to 683,738
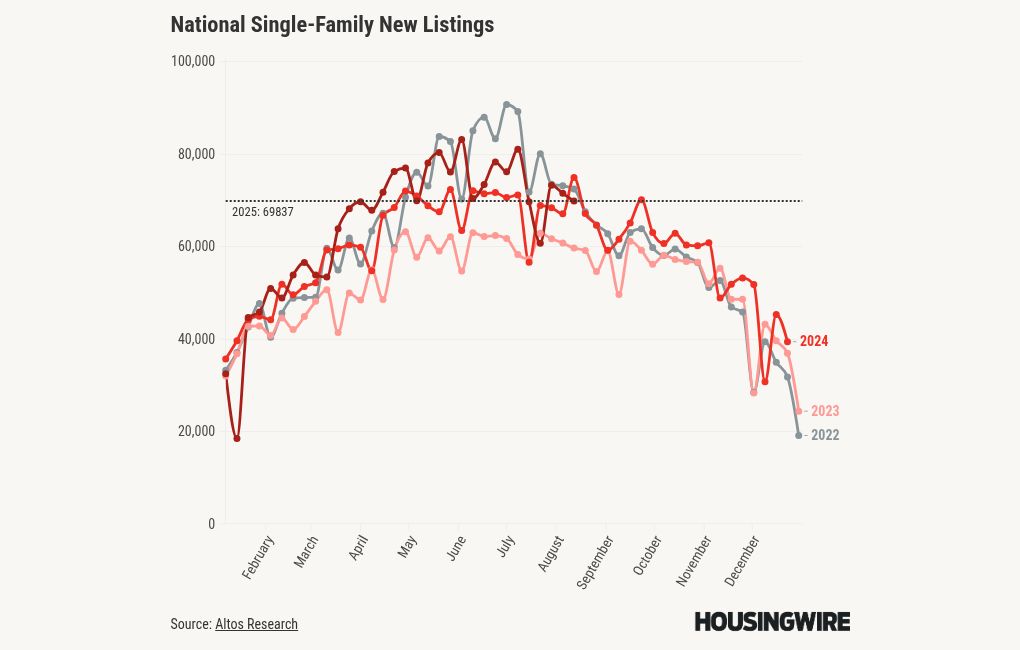
New listings data
New listings data appears to have peaked the week of May 23, with a total of 83,143 listings. While I was pleased to hit my minimum weekly target of 80,000 new listings, I was disappointed that we didn’t see a few weeks with numbers between 80,000 and 100,000. We are well on the way to the seasonal decline in these listings. One thing we don’t want to see is this data line go below the 2023 or 2024 data.
To give you some perspective, during the years of the housing bubble crash, new listings were soaring between 250,000 and 400,000 per week for many years. Here’s last week’s new listings data over the past two years:
- 2025: 69,837
- 2024: 67,083
Price-cut percentage
In a typical year, approximately one-third of homes experience price reductions, highlighting the dynamic nature of the housing market. Homeowners adjust their sale prices as inventory levels rise and mortgage rates stay elevated. With more inventory and higher rates, our price-cut percentage data is higher than last year.
For my 2025 price forecast, I anticipated a modest increase in home prices of approximately 1.77%. This suggests that 2025 will likely see negative real home prices again. In 2024, my forecast of a 2.33% increase proved inaccurate, primarily because rates fell to around 6% and demand improved in the second half of the year. As a result, home prices increased by 4% in 2024.
The rise in price reductions this year compared to last year reinforces my cautious growth forecast for 2025. Here are the percentages of homes that saw price reductions in the previous week in the last two years:

The week ahead: ISM & PMI, bond auctions and jobless claims
After the hectic week filled with job data releases and the Federal Reserve meeting, the upcoming week is likely to feel much calmer, giving us a chance to catch our breath. We will have some ISM and PMI data that could influence the markets, along with a few bond auctions and the weekly jobless claims report to watch.
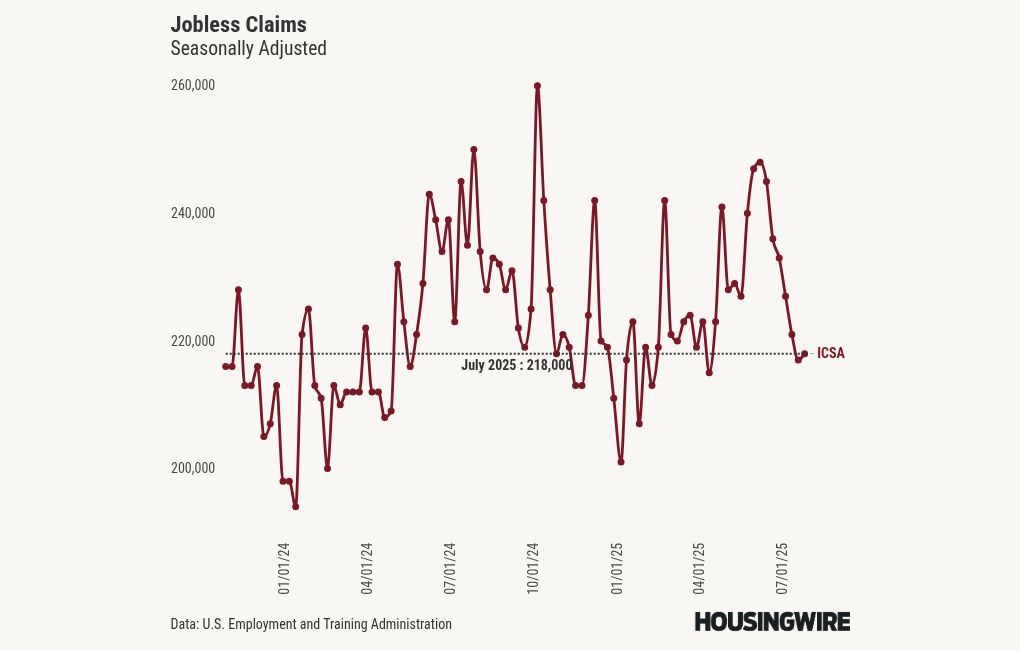
The jobless claims data is a crucial indicator for the Federal Reserve. They aim to maintain their moderately restrictive policy for as long as they can, but if this data begins to break higher, their stance could be at risk. Last week was tumultuous, and as we look ahead to this week, we should take a moment to reflect. Some members of the Fed may need to rethink their established views.