Stock pickers are generally looking for stocks that will outperform the broader market. And the truth is, you can make significant gains if you buy good quality businesses at the right price. For example, long term Kenanga Investment Bank Berhad (KLSE:KENANGA) shareholders have enjoyed a 84% share price rise over the last half decade, well in excess of the market return of around 1.2% (not including dividends). On the other hand, the more recent gains haven’t been so impressive, with shareholders gaining just 27% , including dividends .
Now it’s worth having a look at the company’s fundamentals too, because that will help us determine if the long term shareholder return has matched the performance of the underlying business.
Check out our latest analysis for Kenanga Investment Bank Berhad
There is no denying that markets are sometimes efficient, but prices do not always reflect underlying business performance. One way to examine how market sentiment has changed over time is to look at the interaction between a company’s share price and its earnings per share (EPS).
Over half a decade, Kenanga Investment Bank Berhad managed to grow its earnings per share at 43% a year. This EPS growth is higher than the 13% average annual increase in the share price. So it seems the market isn’t so enthusiastic about the stock these days. The reasonably low P/E ratio of 10.70 also suggests market apprehension.
The image below shows how EPS has tracked over time (if you click on the image you can see greater detail).
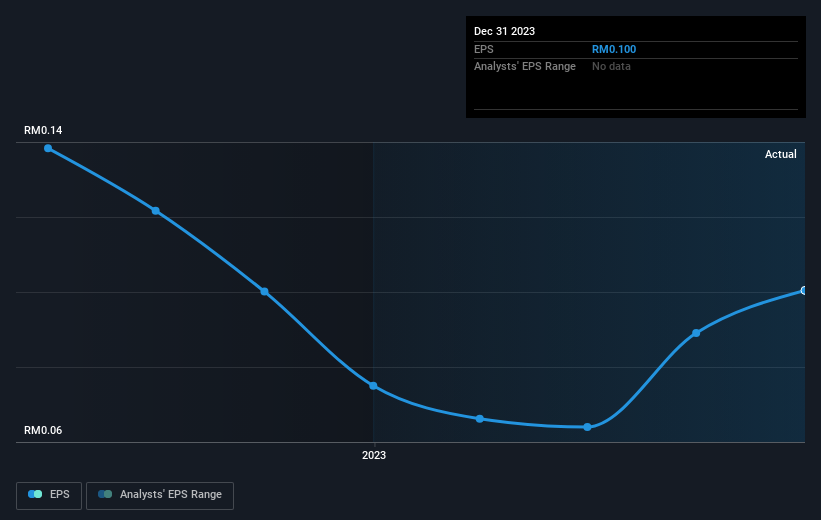
Dive deeper into Kenanga Investment Bank Berhad’s key metrics by checking this interactive graph of Kenanga Investment Bank Berhad’s earnings, revenue and cash flow.
What About Dividends?
When looking at investment returns, it is important to consider the difference between total shareholder return (TSR) and share price return. The TSR is a return calculation that accounts for the value of cash dividends (assuming that any dividend received was reinvested) and the calculated value of any discounted capital raisings and spin-offs. It’s fair to say that the TSR gives a more complete picture for stocks that pay a dividend. In the case of Kenanga Investment Bank Berhad, it has a TSR of 146% for the last 5 years. That exceeds its share price return that we previously mentioned. And there’s no prize for guessing that the dividend payments largely explain the divergence!
A Different Perspective
We’re pleased to report that Kenanga Investment Bank Berhad shareholders have received a total shareholder return of 27% over one year. And that does include the dividend. That gain is better than the annual TSR over five years, which is 20%. Therefore it seems like sentiment around the company has been positive lately. Someone with an optimistic perspective could view the recent improvement in TSR as indicating that the business itself is getting better with time. I find it very interesting to look at share price over the long term as a proxy for business performance. But to truly gain insight, we need to consider other information, too. For instance, we’ve identified 1 warning sign for Kenanga Investment Bank Berhad that you should be aware of.
Of course Kenanga Investment Bank Berhad may not be the best stock to buy. So you may wish to see this free collection of growth stocks.
Please note, the market returns quoted in this article reflect the market weighted average returns of stocks that currently trade on Malaysian exchanges.
Have feedback on this article? Concerned about the content? Get in touch with us directly. Alternatively, email editorial-team (at) simplywallst.com.
This article by Simply Wall St is general in nature. We provide commentary based on historical data and analyst forecasts only using an unbiased methodology and our articles are not intended to be financial advice. It does not constitute a recommendation to buy or sell any stock, and does not take account of your objectives, or your financial situation. We aim to bring you long-term focused analysis driven by fundamental data. Note that our analysis may not factor in the latest price-sensitive company announcements or qualitative material. Simply Wall St has no position in any stocks mentioned.