MattZ90/iStock via Getty Images
The iShares MBS ETF (NASDAQ:MBB) serves as a one-stop shop for U.S. mortgage-backed securities, primarily issued by Ginnie Mae, Fannie Mae and Freddie Mac. The latter two entities are sponsored by the government, as opposed to Ginnie Mae, which is owned by them. The holdings corroborate the preponderance of the terrific trio in the ETF’s portfolio.
MBB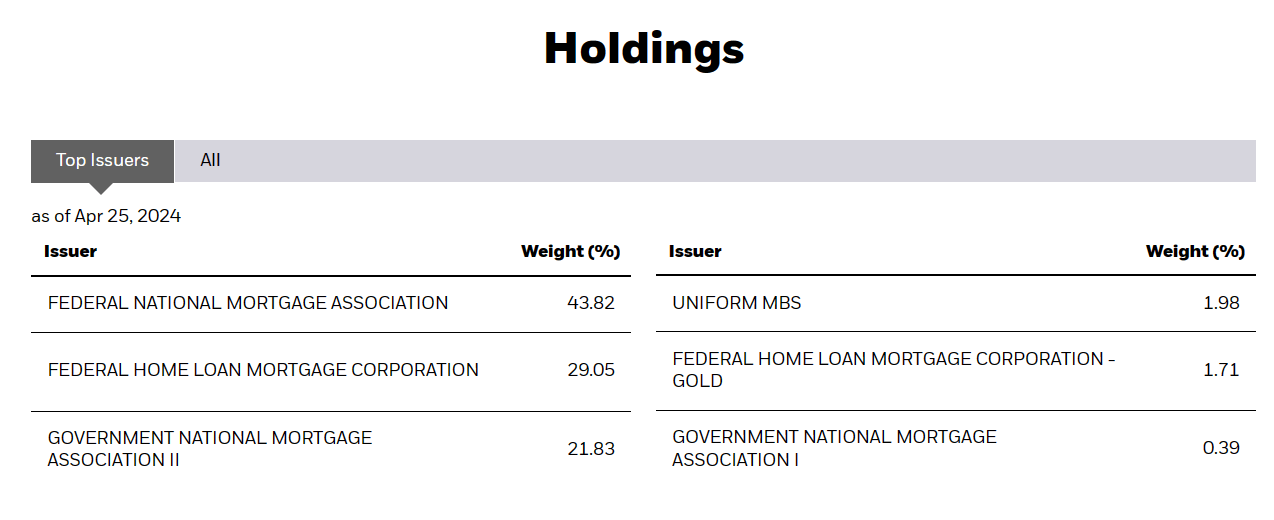
This income seeking, exchange traded fund is passive by nature. Which means that its purpose is to track the investment results of an index, making no effort to outperform it or react to the changing market conditions. The index in question for our protagonist is the Bloomberg U.S. MBS Index. The securities included in this index are issued by the aforementioned enterprises and have maturities of 15, 30 or 20 years. To be eligible for inclusion in the index, the security needs to have at least a year left to maturity.
MBB uses the representative sampling indexing strategy in its endeavor to mirror the results of the benchmark. This entails holding a portfolio of securities that have investment and fundamental characteristics similar to that of the index components. The ETF aims to invest at least 90% of its assets in types of securities that are included in the index. MBB has annual expenses of 0.04%, whereas the index has none.
MBB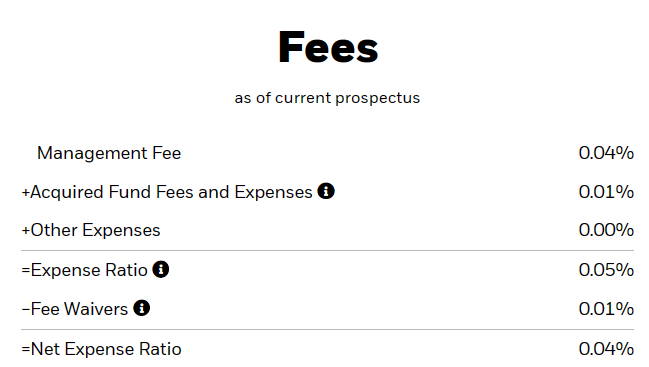
The ETF’s under performance vis a vis the benchmark in almost all time frames is more than what can be accounted for by its expenses. We will note here that the expenses were higher previously and have now been reduced to a rounding error.
MBB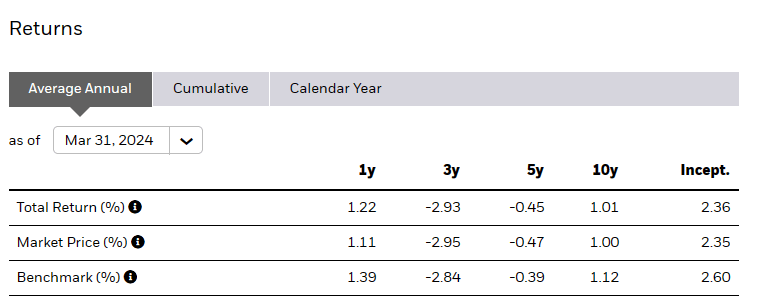
Where This Fits In Your Allocation?
Mortgage Backed Securities have frequently been a talking point on Seeking Alpha. The reason they have come up so often is because many love to chase mortgage REITs, and they own, primarily, Mortgage Backed Securities. The recent discussion has centered around the fact that these are cheap and the ones making that claim are not wrong. You can see in the chart below, that the spread is usually about 50 basis points relative to comparable Treasuries.
Bloomberg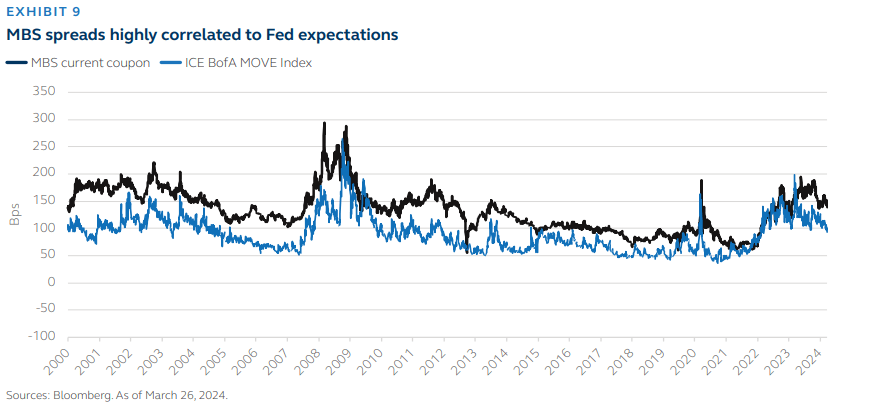
The word “usually” refers to in quiet times. As the above chart also shows, when bond volatility index or MOVE spikes, the spread spikes as well. Today we are getting a wider spread and that is the cause of all the excitement. Note that the chart runs till March 26, 2024.
Now, this spread is, in a way, a risk-free spread. These securities are government-guaranteed, so you are getting the same implied credit as that of the US Treasuries. So why does everyone not invest every single dollar in these versus US Treasuries? The answer is that while their credit risk is identical, their duration risk is very unusual. If you buy a 10-Year Treasury and hold till maturity, you have your return profile setup in the beginning. The price may certainly move in the interim, but you know what you are getting. With Mortgage Backed Securities, you have a can of worms, and it is hard to predict exactly what you will get. The biggest issue is that their duration is an estimate. While these are 15 and 30 year securities to start off with, the regular payments of principal reduce the duration. There is flexibility to also pay additional principal in many cases without penalties. More importantly, there is a huge risk if rates fall and these get refinanced at lower rates. So Mortgage Backed Securities have a huge negative convexity. That in simple terms means that they appreciate a lot less than similar (non-callable) bonds when rates drop.
With all that said, they these bonds should still form part of investor’s portfolio as that extra spread (50 basis points in normal times, and way more today) does add some juice to a portfolio.
Does MBB Fit Your Portfolio?
The main issue with MBB is that it holds a lot of vintage low coupon bonds, which are part of the index. So if you look at the portfolio characteristics, there is a massive gap between the weighted average coupon and the average yield to maturity.
MBB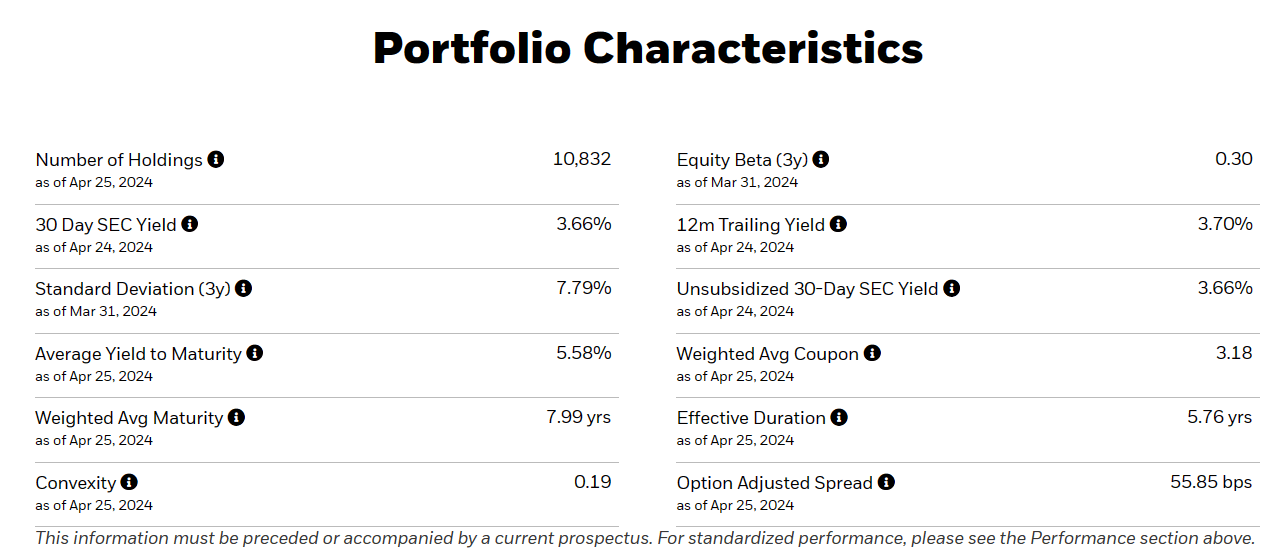
As a result of this, the payments are nowhere near the yields that can you get on newer bonds. MBB’s distribution is yield is 3.77% and it likely rises over time. But this will be little solace to the income investor getting 5.0% plus on Treasuries and up to 5.5% on 1 year CDs. As a standalone, they can be disappointing. Plus, you may already have exposure to this area without knowing. Most 60:40 and target date retirement funds allocate handily to these securities. For example, we use iShares Core Growth Allocation ETF (AOR), as our primary benchmark in our Marketplace Service. That fund shows the following holdings.
Seeking Alpha-AOR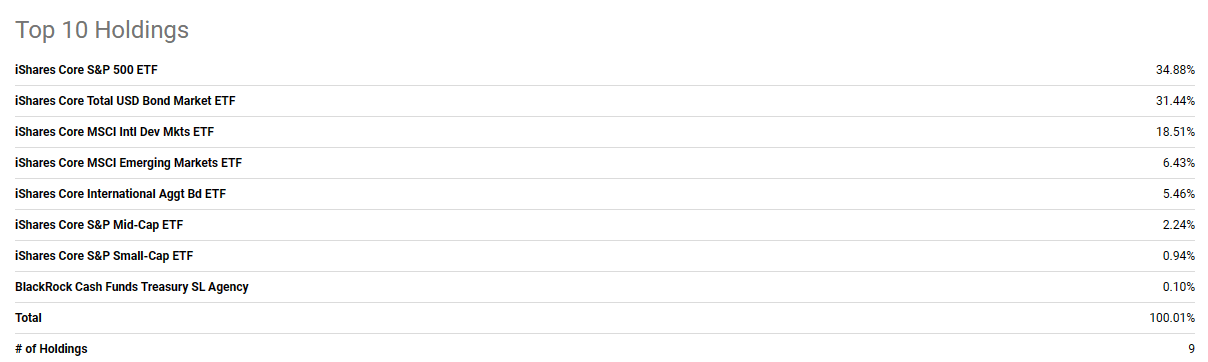
Ok, so you may think that there are no Mortgage Backed Securities there. But if you look deeper in to the second holding, iShares Core Total USD Bond Market ETF (IUSB), you see these as the primary holdings.
IUSB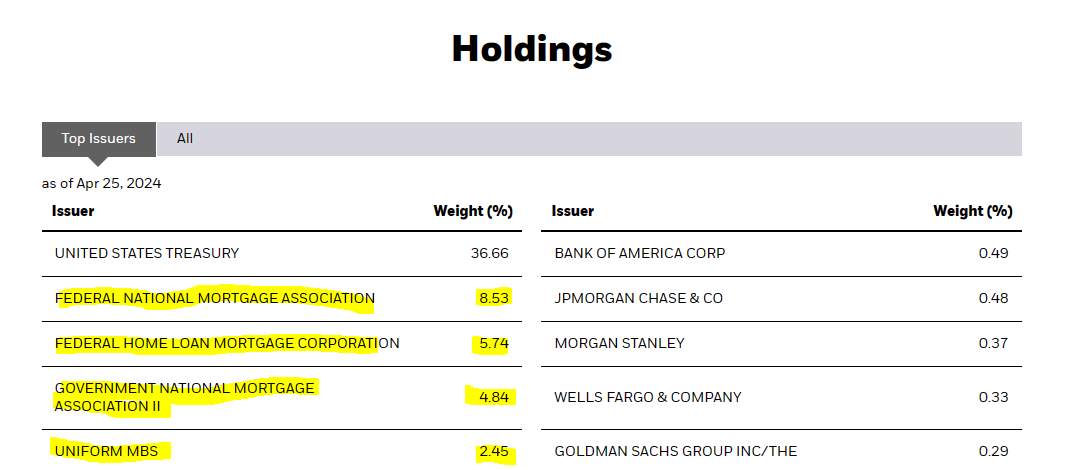
So if you are investing via any total market ETFs on the bond side, chances are that you are getting your fill. If you are an investor that is doing the heavy lifting via individual allocations, and income is not the most important thing to you right now, an allocation to MBB might make sense for you. We don’t own MBB at present, but we have our eyes on a couple of other similar funds that we might pull the trigger on and issue an alert for our subscribers. Our position has so far been that longer dated yields on bonds are not compensating you for the risks, and so far, we have been right to stay away. But the moment to go “all-in” on Treasuries is drawing close, and the extra spread on Mortgage Backed Securities is one we might get behind.
Please note that this is not financial advice. It may seem like it, sound like it, but surprisingly, it is not. Investors are expected to do their own due diligence and consult a professional who knows their objectives and constraints