

In order to justify the effort of selecting individual stocks, it’s worth striving to beat the returns from a market index fund. But the risk of stock picking is that you will likely buy under-performing companies. Unfortunately, that’s been the case for longer term Scales Corporation Limited (NZSE:SCL) shareholders, since the share price is down 33% in the last three years, falling well short of the market decline of around 13%.
So let’s have a look and see if the longer term performance of the company has been in line with the underlying business’ progress.
Check out our latest analysis for Scales
There is no denying that markets are sometimes efficient, but prices do not always reflect underlying business performance. One imperfect but simple way to consider how the market perception of a company has shifted is to compare the change in the earnings per share (EPS) with the share price movement.
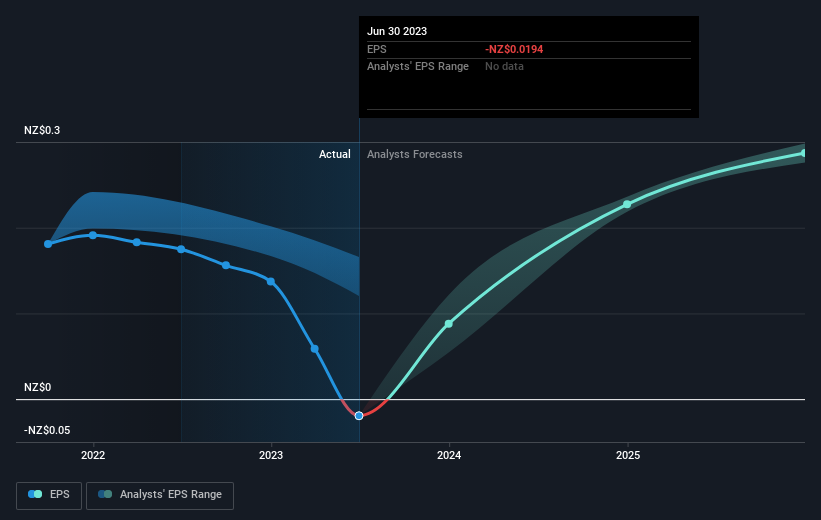
Scales saw its share price decline over the three years in which its EPS also dropped, falling to a loss. This was, in part, due to extraordinary items impacting earnings. Since the company has fallen to a loss making position, it’s hard to compare the change in EPS with the share price change. However, we can say we’d expect to see a falling share price in this scenario.
The graphic below depicts how EPS has changed over time (unveil the exact values by clicking on the image).
We consider it positive that insiders have made significant purchases in the last year. Even so, future earnings will be far more important to whether current shareholders make money. It might be well worthwhile taking a look at our free report on Scales’ earnings, revenue and cash flow.
What About Dividends?
When looking at investment returns, it is important to consider the difference between total shareholder return (TSR) and share price return. The TSR is a return calculation that accounts for the value of cash dividends (assuming that any dividend received was reinvested) and the calculated value of any discounted capital raisings and spin-offs. Arguably, the TSR gives a more comprehensive picture of the return generated by a stock. As it happens, Scales’ TSR for the last 3 years was -21%, which exceeds the share price return mentioned earlier. And there’s no prize for guessing that the dividend payments largely explain the divergence!
A Different Perspective
Investors in Scales had a tough year, with a total loss of 12% (including dividends), against a market gain of about 2.6%. Even the share prices of good stocks drop sometimes, but we want to see improvements in the fundamental metrics of a business, before getting too interested. Regrettably, last year’s performance caps off a bad run, with the shareholders facing a total loss of 0.8% per year over five years. Generally speaking long term share price weakness can be a bad sign, though contrarian investors might want to research the stock in hope of a turnaround. It’s always interesting to track share price performance over the longer term. But to understand Scales better, we need to consider many other factors. For example, we’ve discovered 1 warning sign for Scales that you should be aware of before investing here.
If you like to buy stocks alongside management, then you might just love this free list of companies. (Hint: insiders have been buying them).
Please note, the market returns quoted in this article reflect the market weighted average returns of stocks that currently trade on New Zealander exchanges.
Have feedback on this article? Concerned about the content? Get in touch with us directly. Alternatively, email editorial-team (at) simplywallst.com.
This article by Simply Wall St is general in nature. We provide commentary based on historical data and analyst forecasts only using an unbiased methodology and our articles are not intended to be financial advice. It does not constitute a recommendation to buy or sell any stock, and does not take account of your objectives, or your financial situation. We aim to bring you long-term focused analysis driven by fundamental data. Note that our analysis may not factor in the latest price-sensitive company announcements or qualitative material. Simply Wall St has no position in any stocks mentioned.


