
The worst result, after buying shares in a company (assuming no leverage), would be if you lose all the money you put in. But on the bright side, if you buy shares in a high quality company at the right price, you can gain well over 100%. One great example is Raymond James Financial, Inc. (NYSE:RJF) which saw its share price drive 128% higher over five years. On top of that, the share price is up 15% in about a quarter. But this move may well have been assisted by the reasonably buoyant market (up 9.4% in 90 days).
Let’s take a look at the underlying fundamentals over the longer term, and see if they’ve been consistent with shareholders returns.
See our latest analysis for Raymond James Financial
While markets are a powerful pricing mechanism, share prices reflect investor sentiment, not just underlying business performance. One imperfect but simple way to consider how the market perception of a company has shifted is to compare the change in the earnings per share (EPS) with the share price movement.
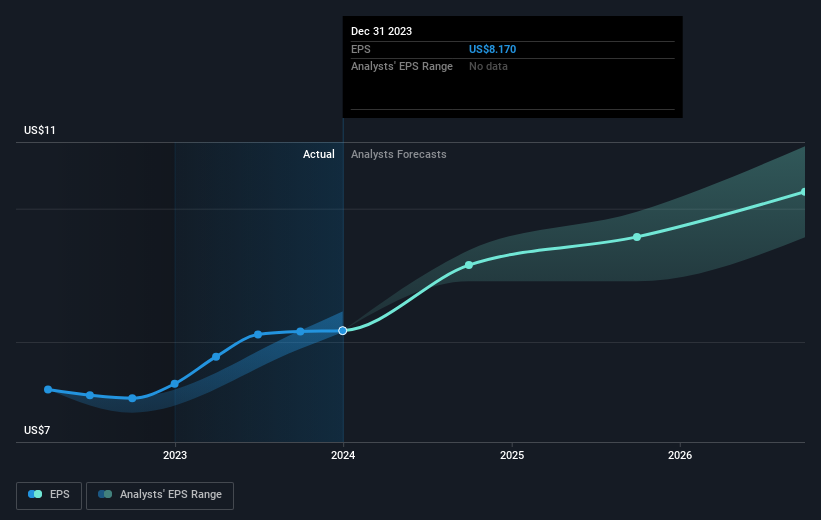
During five years of share price growth, Raymond James Financial achieved compound earnings per share (EPS) growth of 13% per year. This EPS growth is lower than the 18% average annual increase in the share price. This suggests that market participants hold the company in higher regard, these days. That’s not necessarily surprising considering the five-year track record of earnings growth.
The company’s earnings per share (over time) is depicted in the image below (click to see the exact numbers).
We know that Raymond James Financial has improved its bottom line lately, but is it going to grow revenue? Check if analysts think Raymond James Financial will grow revenue in the future.
What About Dividends?
As well as measuring the share price return, investors should also consider the total shareholder return (TSR). Whereas the share price return only reflects the change in the share price, the TSR includes the value of dividends (assuming they were reinvested) and the benefit of any discounted capital raising or spin-off. So for companies that pay a generous dividend, the TSR is often a lot higher than the share price return. In the case of Raymond James Financial, it has a TSR of 147% for the last 5 years. That exceeds its share price return that we previously mentioned. The dividends paid by the company have thusly boosted the total shareholder return.
A Different Perspective
It’s nice to see that Raymond James Financial shareholders have received a total shareholder return of 42% over the last year. Of course, that includes the dividend. Since the one-year TSR is better than the five-year TSR (the latter coming in at 20% per year), it would seem that the stock’s performance has improved in recent times. Someone with an optimistic perspective could view the recent improvement in TSR as indicating that the business itself is getting better with time. If you would like to research Raymond James Financial in more detail then you might want to take a look at whether insiders have been buying or selling shares in the company.
We will like Raymond James Financial better if we see some big insider buys. While we wait, check out this free list of growing companies with considerable, recent, insider buying.
Please note, the market returns quoted in this article reflect the market weighted average returns of stocks that currently trade on American exchanges.
Valuation is complex, but we’re helping make it simple.
Find out whether Raymond James Financial is potentially over or undervalued by checking out our comprehensive analysis, which includes fair value estimates, risks and warnings, dividends, insider transactions and financial health.
Have feedback on this article? Concerned about the content? Get in touch with us directly. Alternatively, email editorial-team (at) simplywallst.com.
This article by Simply Wall St is general in nature. We provide commentary based on historical data and analyst forecasts only using an unbiased methodology and our articles are not intended to be financial advice. It does not constitute a recommendation to buy or sell any stock, and does not take account of your objectives, or your financial situation. We aim to bring you long-term focused analysis driven by fundamental data. Note that our analysis may not factor in the latest price-sensitive company announcements or qualitative material. Simply Wall St has no position in any stocks mentioned.