When you buy shares in a company, it’s worth keeping in mind the possibility that it could fail, and you could lose your money. But on the bright side, if you buy shares in a high quality company at the right price, you can gain well over 100%. One great example is Chemed Corporation (NYSE:CHE) which saw its share price drive 104% higher over five years. Also pleasing for shareholders was the 16% gain in the last three months. But this could be related to the strong market, which is up 14% in the last three months.
With that in mind, it’s worth seeing if the company’s underlying fundamentals have been the driver of long term performance, or if there are some discrepancies.
Check out our latest analysis for Chemed
There is no denying that markets are sometimes efficient, but prices do not always reflect underlying business performance. One flawed but reasonable way to assess how sentiment around a company has changed is to compare the earnings per share (EPS) with the share price.
Over half a decade, Chemed managed to grow its earnings per share at 4.9% a year. This EPS growth is slower than the share price growth of 15% per year, over the same period. This suggests that market participants hold the company in higher regard, these days. That’s not necessarily surprising considering the five-year track record of earnings growth.
The image below shows how EPS has tracked over time (if you click on the image you can see greater detail).
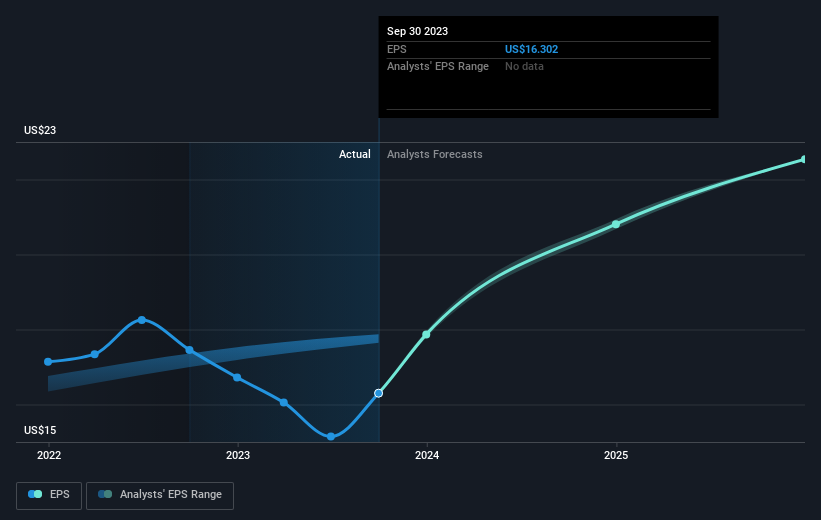
It might be well worthwhile taking a look at our free report on Chemed’s earnings, revenue and cash flow.
What About Dividends?
When looking at investment returns, it is important to consider the difference between total shareholder return (TSR) and share price return. Whereas the share price return only reflects the change in the share price, the TSR includes the value of dividends (assuming they were reinvested) and the benefit of any discounted capital raising or spin-off. So for companies that pay a generous dividend, the TSR is often a lot higher than the share price return. As it happens, Chemed’s TSR for the last 5 years was 107%, which exceeds the share price return mentioned earlier. The dividends paid by the company have thusly boosted the total shareholder return.
A Different Perspective
Chemed provided a TSR of 20% over the year (including dividends). That’s fairly close to the broader market return. Most would be happy with a gain, and it helps that the year’s return is actually better than the average return over five years, which was 16%. Even if the share price growth slows down from here, there’s a good chance that this is business worth watching in the long term. It’s always interesting to track share price performance over the longer term. But to understand Chemed better, we need to consider many other factors. For example, we’ve discovered 1 warning sign for Chemed that you should be aware of before investing here.
Of course, you might find a fantastic investment by looking elsewhere. So take a peek at this free list of companies we expect will grow earnings.
Please note, the market returns quoted in this article reflect the market weighted average returns of stocks that currently trade on American exchanges.
Valuation is complex, but we’re helping make it simple.
Find out whether Chemed is potentially over or undervalued by checking out our comprehensive analysis, which includes fair value estimates, risks and warnings, dividends, insider transactions and financial health.
Have feedback on this article? Concerned about the content? Get in touch with us directly. Alternatively, email editorial-team (at) simplywallst.com.
This article by Simply Wall St is general in nature. We provide commentary based on historical data and analyst forecasts only using an unbiased methodology and our articles are not intended to be financial advice. It does not constitute a recommendation to buy or sell any stock, and does not take account of your objectives, or your financial situation. We aim to bring you long-term focused analysis driven by fundamental data. Note that our analysis may not factor in the latest price-sensitive company announcements or qualitative material. Simply Wall St has no position in any stocks mentioned.