

Editor’s Note: A version of this article was previously published on Dec. 5, 2022.
Correction (Feb. 2, 2024): 15 Funds That Have Destroyed the Most Wealth Over the Past Decade, published Jan. 31, was temporarily unpublished while the piece was reviewed internally. The text and tables have been revised to correct a data issue that caused incorrect market appreciation numbers for certain income-oriented ETFs. In addition, we removed two other funds from the list of 15 funds included in the first exhibit. The market appreciation figure for Principal Diversified International Fund PDIFX did not reflect an in-kind transfer from the mutual fund to a sibling CIT vehicle. The market appreciation figure for Delaware Ivy Asset Strategy Fund Cl C WASCX did not reflect a consolidation of assets from related vehicles that took place in 2013.
Last week, I wrote about the 15 mutual funds and exchange-traded funds that created the most value for shareholders in dollar terms over the trailing 10-year period ended in 2023. To come up with the list, I ranked Morningstar’s database of U.S.-based mutual funds and ETFs, focusing on those that had the biggest increase in asset size over the 10-year period ended in 2023 after subtracting out total inflows and outflows over the same period. The resulting number reflects how much growth a fund has created from market appreciation in dollars.
Thanks to the generally bullish market that prevailed over most of this period, mutual funds and ETFs created a total of $11.1 trillion in shareholder value over the 10-year period.
This week, I’ll look at this from the opposite perspective, focusing on equity and alternative funds that have lost value for shareholders over the same period. For this list, I used a slightly different calculation based on how much appreciation (or depreciation, in this case) each fund generated in dollar terms over the trailing 10-year period [1].
The Results
While the top wealth creators were all large, well-known names from some of the largest categories based on asset size, the wealth destroyers are a motley crew of more-specialized fund categories.
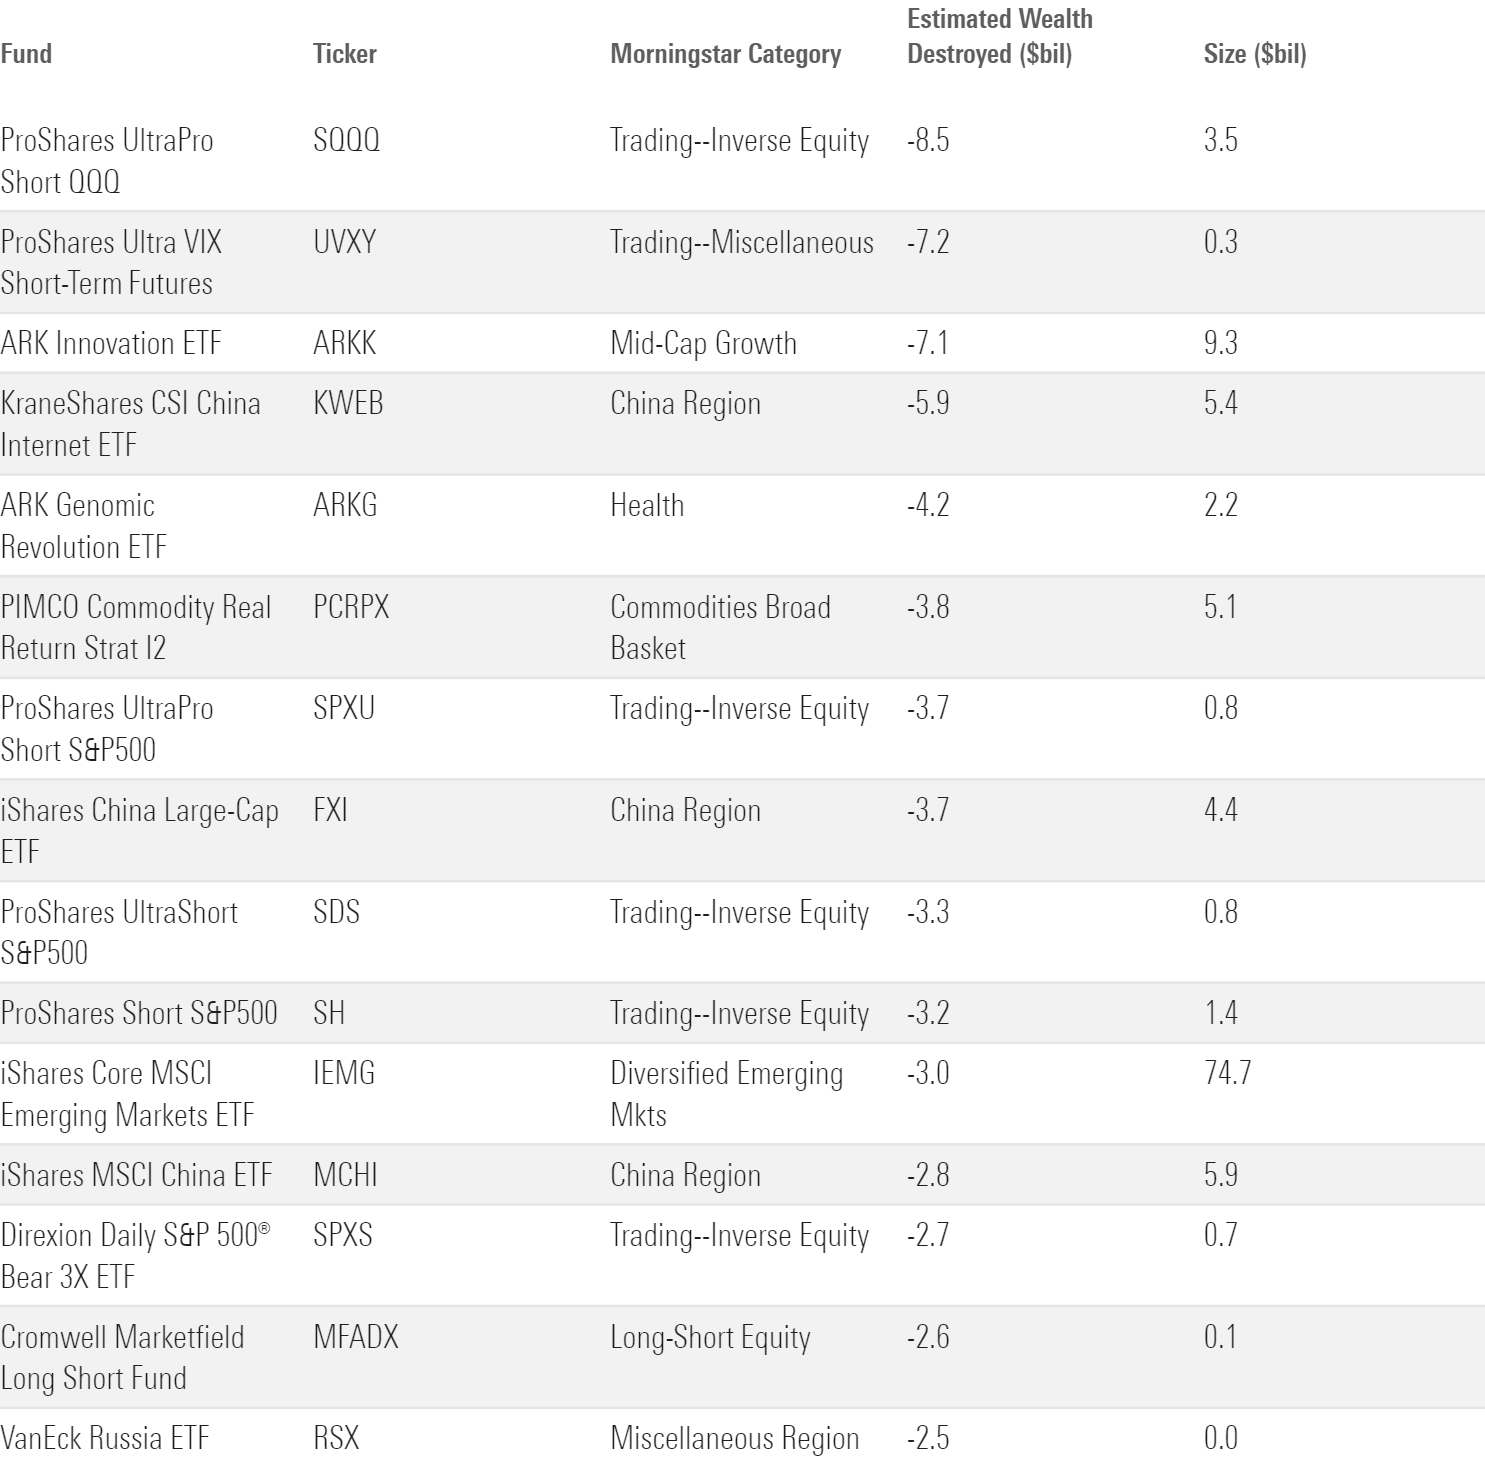
Fourteen of the top 15 funds on our wealth destroyers list are exchange-traded products. ETFs have many things going for them—including low costs, tax efficiency, and typically a passive investment approach that makes them suitable building blocks for diversified portfolios—but they also have a dark side. ETFs often focus on narrowly defined market sectors and asset classes, making them potentially dangerous when used by investors with a speculative bent.
When I looked at the biggest “wealth creators” in the fund industry, the list was dominated by the biggest fund families, including Vanguard, Fidelity, and American Funds. This reflects a positive feedback loop of size and performance: Strong performance attracts more assets, which in turn means the biggest fund shops have the most impact on wealth creation in dollar terms. Not surprisingly, most of the firms that have destroyed shareholder value are on the smaller end of the fund industry based on asset size. Credit Suisse, for example, is a giant in the world of Swiss banking but a relatively small player in the U.S. fund industry.
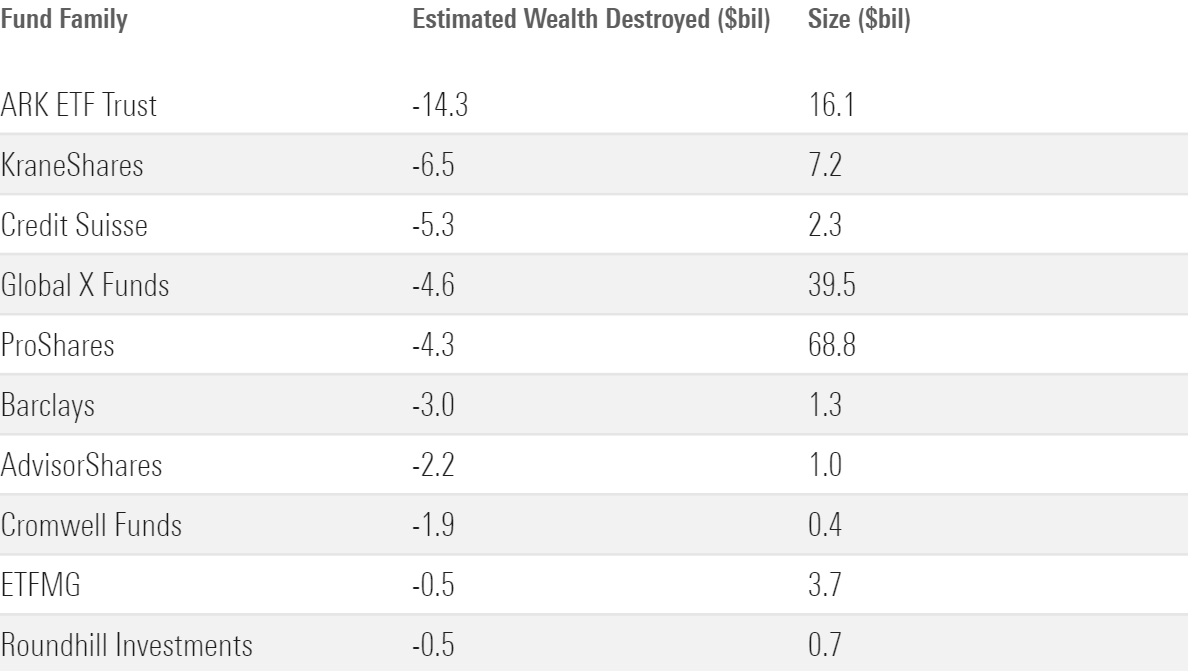
ARK, home of the flagship ARK Innovation ETF ARKK, tops the list for value destruction. After garnering huge asset flows in 2020 and 2021 (totaling an estimated $29.2 billion), its funds were decimated in the 2022 bear market, with losses ranging from 34.1% to 67.5% for the year. Many of its funds enjoyed a strong rebound in 2023, but that wasn’t enough to offset their previous losses. As a result, the ARK family wiped out an estimated $14.3 billion in shareholder value over the 10-year period—more than twice as much as the second-worst fund family on the list. ARK Innovation alone accounts for about $7.1 billion of value destruction over the trailing 10-year period.
In most cases, the fortunes of the other worst-performing fund families are a product of their investment focus. Many of the firms on our list have lineups that are heavy on specialized and volatile categories, such as commodities, natural resources, and emerging markets—areas that failed to enhance shareholder value during most of the decade covered in our study. Credit Suisse and Global X are two examples of this trend. ProShare’s focus on inverse and leveraged ETFs also led to wealth destruction over the period covered in our study.
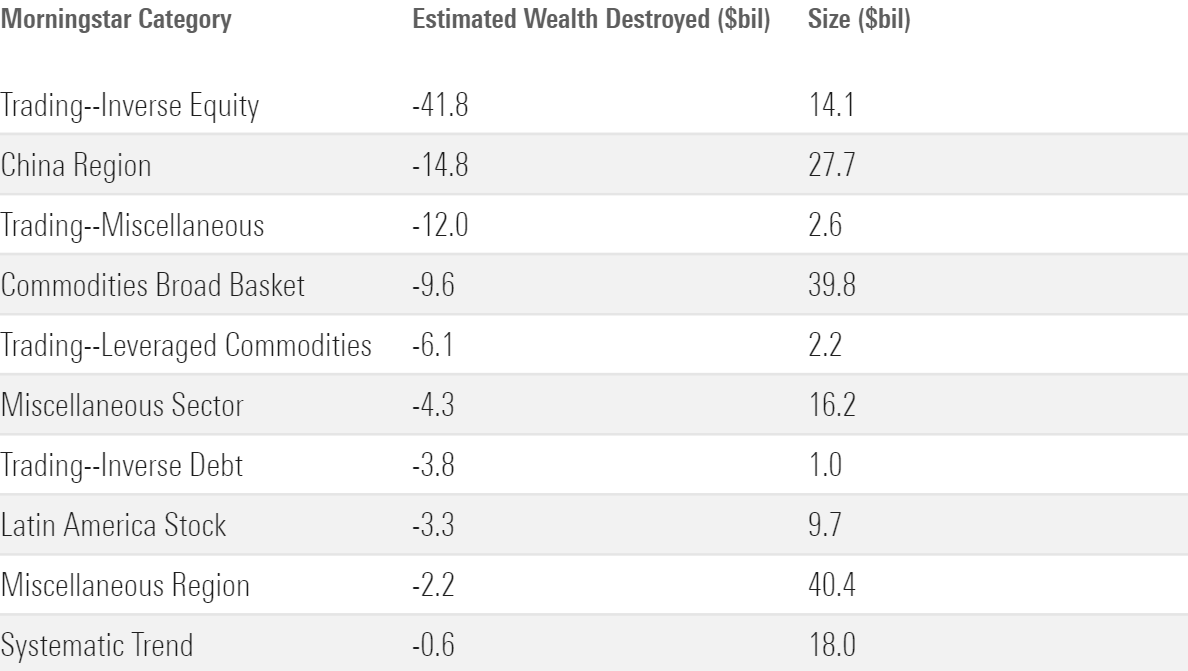
The worst value destroyers by Morningstar Category are a hodgepodge of highly volatile and specialized categories. Two of them—trading-leveraged commodities and commodities broad basket—fared relatively well amid higher inflation in 2021 and 2022. But the remaining categories have little investment merit. For example, our study revealed that trading-inverse equity funds destroyed an estimated $41.8 billion over the trailing 10-year period. These funds occasionally rise to the top by betting against the market; for example, many funds that bet against U.S. stocks were up 15% or more in 2022. But because market returns are positive more often than not, the long-term results haven’t been pretty.
Conclusion
The biggest value destroyers in the fund industry illustrate that there’s no guarantee of success, even during a generally favorable market environment. They also provide a valuable case study in how not to invest. (As Charlie Munger was fond of saying: “Invert, always invert.”) Investors have been far better served by the plain-vanilla fund categories that dominated the winners list, such as large-cap blend, allocation—50% to 70% equity, and foreign large blend. They’ve also generally fared well by sticking with the industry’s biggest and most established fund families. Volatile and speculative categories—as well as unproven fund shops that attract a lot of short-term hype—on the other hand, are best avoided.
[1] Value destruction over the 10-year period reflects the sum of annual depreciation in dollars for each of the trailing 10 calendar years starting in 2014. This is mathematically the same as the method I used for the value creators article but works better in the case of funds that no longer exist or for which we’re missing asset data as of the end of the period.


