A version of this post first appeared on TKer.co
Stocks made new record highs, with the S&P 500 setting an intraday high of 5,264.85 and a closing high of 5,254.35 on Thursday. For the week, the S&P increased 0.4%. The index is now up 10.2% year to date and up 46.9% from its October 12, 2022 closing low of 3,577.03.
Believe it or not, the chart below is real. It reflects monthly developments in a major economic data set. Can you guess what it is?

It’s the past year and a half’s worth of monthly core capex orders, one of the most telling leading indicators of business activity and one of the key tailwinds to the economy.
One month it’s up. The next month it’s down. And then it’s up again. And then it’s down again.

This chart is the latest reminder that economic data can be “full-on Monet“: From a distance, patterns and trends become clear. But up close, it’s a mess.
Analyzing short-term moves in data is treacherous work for anxious investors and traders who are eager to adjust their positions in anticipation of major shifts in the economic narratives.
Unfortunately, the end of a prevailing narrative and the emergence of a new narrative only become clear with months of hindsight. What might initially look like an inflection in a trend is often just noise.
So it’s probably best not to lose one’s mind over one month’s economic data.
The same goes for short-term moves in the financial markets.
Consider the slide below. It’s from a presentation I gave to Columbia Journalism School students in 2022 and lists stock market news story headlines during the seven trading days following news of the Omicron variant of COVID-19 in November 2021.

As you can see, markets zig-zagged during the period. And along the way, major news outlets flip-flopped on the narrative to fit the daily price moves.
This kind of thing happens all the time if you follow markets daily.
The lesson: It’s often futile to draw big conclusions about the world based on short-term moves in market prices and economic data.
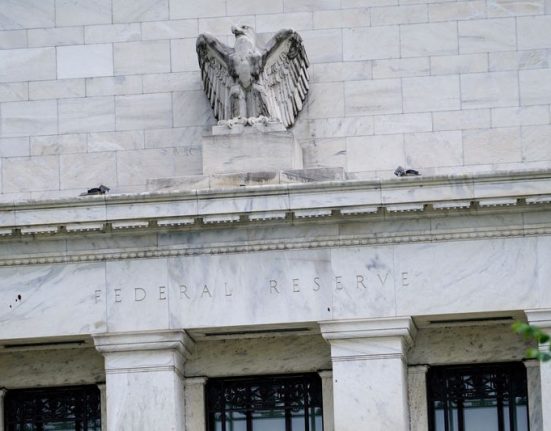
Fed’s Powell: ‘Check yourself’ on the ‘sometimes-bumpy road’
All that said, just because short-term moves aren’t necessarily conclusive doesn’t mean you should ignore them.
That was the message from Federal Reserve Chair Jerome Powell in regards to the recent uptick in inflation data after months of trending lower.
“I always try to be careful about dismissing data that we don’t like,” Powell said during the March 20 press conference. “So, you need to check yourself on that, and I’ll do that.”

Powell was specifically addressing the recent pick up in inflation as measured by the core PCE price index — the Fed’s preferred inflation gauge — in the January and February reports.
“I take the two of them together and I think they haven’t really changed the overall story, which is that of inflation moving down gradually on a sometimes-bumpy road toward 2%,” he said.
In other words, while Powell is mindful of the recent data not going his way, he is not yet willing to call the end of two years worth of cooling inflation.
Zooming out
As I wrote in A 5-step guide to processing ambiguous news in the markets and the economy:
…the first step is to have a robust macro framework…If an economic metric, a company’s earnings announcement, or some other news is in line with your macro framework, then congratulations: You just got confirmation that your macro narrative makes sense.At the same time, it is often the case that individual companies — or even a group of companies — may say something that conflicts with prevailing narrative…A turn in one day’s, one week’s, one month’s, or even one quarter’s worth of data doesn’t always confirm a change in prevailing trends. In the real world, nothing — especially trends in the markets and the economy — develops in the form of smooth, straight lines.The markets will have weeks, the economy will have bad months, and companies will have bad quarters. And sometimes, these periods will prove to be anomalies…
One thing is for sure: If new data goes against the prevailing narrative, there’ll be plenty of pundits on business news arguing why this is indeed an inflection point and that we should brace for a new paradigm.
But again: One piece of data does not make a new narrative, and one piece of data does not break an existing narrative.
Inflection points for big trends can matter in the markets and the economy. Unfortunately, you just can’t know for sure without the benefit of hindsight.
What to do? Manage your risk and be open to the possibility that narratives may be shifting while being wary of data that may eventually prove to be noise.
Worries about surging subprime loan delinquencies may be ‘up to 50%’ misplaced
Debt delinquency rates have been on the rise. For the most part, they can be characterized as normalizing to prepandemic levels.
However one segment of borrowers have raised eyebrows: subprime. Some reported metrics show delinquency rates among those with subprime credit ratings have surged above prepandemic levels.
Yes, it appears to be the case that a growing share of subprime borrowers are failing to meet their financial obligations. But there’s much more to the story.

Morgan Stanley analysts recently pointed out that many borrowers saw their credit ratings improve in recent years as their finances improved. That means many borrowers have moved out of the subprime category. The effect of this migration has made for a mathematical quirk that has boosted reported subprime delinquency rates. From Morgan Stanley’s March 26 research note (emphasis added):
According to our analysis, credit score migration can help explain up to 50% of the recent increase in delinquencies of any given score group. … The role of credit score migration has been a major topic of conversation, and we now have data to analyze the impacts. Using auto loans originated in 2022 and 2018, we attempt to separate out the impact of macro factors versus the impact of credit score changes on performance. At most parts of the score spectrum, we find that 30-50% of the increase in delinquencies between the two vintages can be attributed to effects of credit score migration…Credit score migration helps explain 30-50% of the recent increase in delinquencies in auto loans. (Source)
Morgan Stanley is building on earlier work from Federal Reserve researchers. In a January 12 report titled “The Effects of Credit Score Migration on Subprime Auto Loan and Credit Card Delinquencies,” the Fed researchers modeled subprime delinquency rates in a scenario where subprime borrowers did not migrate to higher tier credit ratings.
“We find that counterfactual subprime delinquency rates were both considerably lower and have shown more muted increases,” the researchers found.

Morgan Stanley’s Sarah Wolfe summarized three conclusions to take away from all this (emphasis added):
1) In addition to elevated inflation and rapid growth in consumer leverage post- Covid, the scoring effect helps explain why delinquencies have moved higher despite strong employment/consumer spending data, 2) Do not look just to the classic macro indicators to forecast delinquencies, and vice versa, do not extract delinquencies as a perfect barometer for consumer health by income group, and 3) While banks have been well aware of this credit score migration phenomenon, underwriting standards may not have reacted as quickly to ongoing score migration, meaning banks effectively widened their credit boxes…one reason why delinquencies have increased over the past 1-2 years. Altogether, the scoring effect combined with the classic macro variables all point to consumer health that is not as bad as the raw delinquency data would suggest…
Zooming out
There’s no question delinquency rates are rising.
However, we have to be mindful of the nuances of data, especially when they lead to conclusions that don’t align with other data.
Oppenheimer, RBC raise their targets for the S&P 500
On Monday, Oppenheimer’s John Stoltzfus raised his year-end target for the S&P 500 to 5,500 from 5,200. This is his first revision from his initial target.
“S&P 500 earnings results over the most recent two quarterly reporting seasons, economic data that persists in showing resilience, the Fed’s mandate-sensitive monetary policy, and prospects for innovation coupled with cross generational demographic needs that suggest a shift in mindset driven not so much by fear and greed but a need to invest for intermediate to longer-term goals suggest to us an opportunity to tweak our target higher,” Stoltzfus wrote.
On Thursday, RBC’s Lori Calvasina raised her year-end target for the S&P 500 to 5,300 from 5,150. This is her second revision from her initial target.
“The story we see in the data today is that the strong move observed in the S&P 500 so far this year has been deserved, and a rational case can be made for additional upside from here,” she wrote. “But some of our work also suggests that gains may be tougher to come by from here and that the stock market needs a breather.”
Stoltzfus and Calvasina are not alone in tweaking their forecasts. Their peers at Societe Generale, BofA, Barclays, UBS, Goldman Sachs, and CFRA are among those who’ve also raised their targets.
Don’t be surprised to see more of these revisions as the S&P 500’s performance, so far, has exceeded many strategists’ expectations.

Reviewing the macro crosscurrents
There were a few notable data points and macroeconomic developments from last week to consider:
Inflation trends continue to cool. The personal consumption expenditures (PCE) price index in February was up 2.5% from a year ago, up from January’s 2.4% rate. The core PCE price index — the Federal Reserve’s preferred measure of inflation — was up 2.8% during the month, the lowest print since March 2021.
On a month over month basis, the core PCE price index was up 0.3%, down from the prior month’s print of 0.5%. If you annualized the rolling three-month and six-month figures, the core PCE price index was up 2.5% and 2.9%, respectively.

While inflation rates are hovering near the Federal Reserve’s target rate of 2%, the central bank has indicated that it wants prices to stay cool for a little while before it is confident that inflation is under control. So even though there may not be more rate hikes and rate cuts may be around the corner, rates are likely to be kept high for a while.
Consumers are spending. According to BEA data, personal consumption expenditures increased 0.8% month over month in February to a record annual rate of $19.19 trillion.
Adjusted for inflation, real personal consumption expenditures increased by 0.4%.
Consumer vibes recovery takes a breather. From The Conference Board’s March Consumer Confidence survey: “Consumers’ assessment of the present situation improved in March, but they also became more pessimistic about the future. Confidence rose among consumers aged 55 and over but deteriorated for those under 55. Separately, consumers in the $50,000-$99,999 income group reported lower confidence in March, while confidence improved slightly in all other income groups. However, over the last six months, confidence has been moving sideways with no real trend to the upside or downside either by income or age group.”

From the University of Michigan’s March Surveys of Consumers: “Consumer sentiment recorded an incremental increase of less than three index points from February, well within the margin of error and stable since January. Critically, consumers exhibited confidence that inflation will continue to soften. Assessments and expectations of personal finances improved modestly from last month, as the perceived negative effects of high prices and expenses on living standards eased. Strong stock market performance this month supported sentiment gains only for those with the largest holdings, with little impact on the index.”

Labor market confidence improves. From The Conference Board’s February Consumer Confidence survey: “Consumers’ appraisal of the labor market was more positive in March. 43.1% of consumers said jobs were ‘plentiful,’ up from 42.8% in February. 10.9% of consumers said jobs were ‘hard to get,’ down from 12.7%.”
Many economists monitor the spread between these two percentages (a.k.a., the labor market differential), and it’s been reflecting a cooling labor market.

Unemployment claims tick lower. Initial claims for unemployment benefits declined to 210,000 during the week ending March 16, down from 212,000 the week prior. While this is above the September 2022 low of 182,000, it continues to trend at levels historically associated with economic growth.

Card data suggests spending is holding up. From JPMorgan: “As of 22 Mar 2024, our Chase Consumer Card spending data (unadjusted) was 1.5% above the same day last year. Based on the Chase Consumer Card data through 22 Mar 2024, our estimate of the US Census March control measure of retail sales m/m is 0.47%.”

From Bank of America: “Total card spending per HH was up 0.6% y/y in the week ending Mar 23, according to BAC aggregated credit & debit card data. Retail ex auto spending per HH came in at -0.1% y/y in the week ending Mar 23. Spending growth this week has slowed down a little since the week ending Mar 16th.”

Gas prices rise. From AAA: “After an early spring surge, the national average for a gallon of gas spent the past week drifting up and down by a fraction of a cent before settling a penny higher at $3.53. But the break may be temporary, as gas pump prices will likely resume a spring increase.”

Business investment activity is up. Orders for nondefense capital goods excluding aircraft — a.k.a. core capex or business investment — grew 0.7% to $73.87 billion in February.

Core capex orders are a leading indicator, meaning they foretell economic activity down the road. While the growth rate has leveled off a bit, they continue to signal economic strength in the months to come.
Mortgage rates tick lower. According to Freddie Mac, the average 30-year fixed-rate mortgage fell to 6.79% from 6.87% the week prior. From Freddie Mac: “Mortgage rates moved slightly lower this week, providing a bit more room in the budgets of some prospective homebuyers. Additionally, encouraging data out on existing home sales reflects improving inventory. Regardless, rates remain elevated near seven percent as markets watch for signs of cooling inflation, hoping that rates will come down further.”

New home sales tick lower. Sales of newly built homes declined 0.3% in February to an annualized rate of 662,000 units.

Home prices rise. According to the S&P CoreLogic Case-Shiller index, home prices rose 0.4% month-over-month in February. From S&P Dow Jones Indices’ Brian Luke:
“We’ve commented on how consistent each market performed during 2023 and that continues to be the case. While there is a large disparity between leaders such as San Diego versus laggards such as with Portland, the broad market performance is tightly bunched up. This is also true of high and low tiers. The average annual gains between high and low tiers across cities tracked by the indices is just 1.1%. Low price tiered indices have outperformed high priced indices for 17 months.
Homeowners most likely saw healthy gains in the last year, no matter what city you were in, or if it was in an expensive or inexpensive neighborhood. No matter which way you slice it, the index performance closely resembled the broad market.”

Most U.S. states are still growing. From the Philly Fed’s January State Coincident Indexes report: “Over the past three months, the indexes increased in 49 states and decreased in one state, for a three-month diffusion index of 96. Additionally, in the past month, the indexes increased in 39 states, decreased in seven states, and remained stable in four, for a one-month diffusion index of 64.”

Near-term GDP growth estimates look good. The Atlanta Fed’s GDPNow model sees real GDP growth climbing at a 2.3% rate in Q1.

Putting it all together
We continue to get evidence that we are experiencing a bullish “Goldilocks” soft landing scenario where inflation cools to manageable levels without the economy having to sink into recession.
This comes as the Federal Reserve continues to employ very tight monetary policy in its ongoing effort to get inflation under control. While it’s true that the Fed has taken a less hawkish tone in 2023 and 2024 than in 2022, and that most economists agree that the final interest rate hike of the cycle has either already happened, inflation still has to stay cool for a little while before the central bank is comfortable with price stability.
So we should expect the central bank to keep monetary policy tight, which means we should be prepared for relatively tight financial conditions (e.g., higher interest rates, tighter lending standards, and lower stock valuations) to linger. All this means monetary policy will be unfriendly to markets for the time being, and the risk the economy slips into a recession will be relatively elevated.
At the same time, we also know that stocks are discounting mechanisms — meaning that prices will have bottomed before the Fed signals a major dovish turn in monetary policy.
Also, it’s important to remember that while recession risks may be elevated, consumers are coming from a very strong financial position. Unemployed people are getting jobs, and those with jobs are getting raises.
Similarly, business finances are healthy as many corporations locked in low interest rates on their debt in recent years. Even as the threat of higher debt servicing costs looms, elevated profit margins give corporations room to absorb higher costs.
At this point, any downturn is unlikely to turn into economic calamity given that the financial health of consumers and businesses remains very strong.
And as always, long-term investors should remember that recessions and bear markets are just part of the deal when you enter the stock market with the aim of generating long-term returns. While markets have had a pretty rough couple of years, the long-run outlook for stocks remains positive.