ISEC Healthcare (Catalist:40T) has had a rough three months with its share price down 16%. However, a closer look at its sound financials might cause you to think again. Given that fundamentals usually drive long-term market outcomes, the company is worth looking at. In this article, we decided to focus on ISEC Healthcare’s ROE.
Return on equity or ROE is a key measure used to assess how efficiently a company’s management is utilizing the company’s capital. In simpler terms, it measures the profitability of a company in relation to shareholder’s equity.
Check out our latest analysis for ISEC Healthcare
How Do You Calculate Return On Equity?
Return on equity can be calculated by using the formula:
Return on Equity = Net Profit (from continuing operations) ÷ Shareholders’ Equity
So, based on the above formula, the ROE for ISEC Healthcare is:
15% = S$13m ÷ S$85m (Based on the trailing twelve months to March 2024).
The ‘return’ is the income the business earned over the last year. So, this means that for every SGD1 of its shareholder’s investments, the company generates a profit of SGD0.15.
What Is The Relationship Between ROE And Earnings Growth?
We have already established that ROE serves as an efficient profit-generating gauge for a company’s future earnings. We now need to evaluate how much profit the company reinvests or “retains” for future growth which then gives us an idea about the growth potential of the company. Assuming all else is equal, companies that have both a higher return on equity and higher profit retention are usually the ones that have a higher growth rate when compared to companies that don’t have the same features.
ISEC Healthcare’s Earnings Growth And 15% ROE
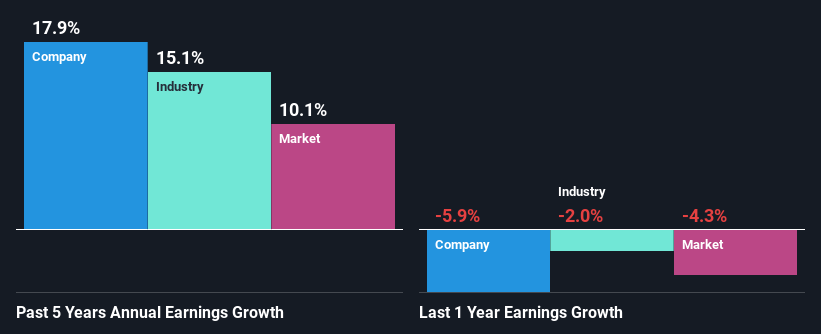
To start with, ISEC Healthcare’s ROE looks acceptable. Further, the company’s ROE compares quite favorably to the industry average of 9.6%. Probably as a result of this, ISEC Healthcare was able to see a decent growth of 18% over the last five years.
We then performed a comparison between ISEC Healthcare’s net income growth with the industry, which revealed that the company’s growth is similar to the average industry growth of 15% in the same 5-year period.
Earnings growth is an important metric to consider when valuing a stock. It’s important for an investor to know whether the market has priced in the company’s expected earnings growth (or decline). By doing so, they will have an idea if the stock is headed into clear blue waters or if swampy waters await. Has the market priced in the future outlook for 40T? You can find out in our latest intrinsic value infographic research report
Is ISEC Healthcare Efficiently Re-investing Its Profits?
The high three-year median payout ratio of 79% (or a retention ratio of 21%) for ISEC Healthcare suggests that the company’s growth wasn’t really hampered despite it returning most of its income to its shareholders.
Additionally, ISEC Healthcare has paid dividends over a period of nine years which means that the company is pretty serious about sharing its profits with shareholders.
Summary
On the whole, we feel that ISEC Healthcare’s performance has been quite good. Especially the high ROE, Which has contributed to the impressive growth seen in earnings. Despite the company reinvesting only a small portion of its profits, it still has managed to grow its earnings so that is appreciable. Up till now, we’ve only made a short study of the company’s growth data. So it may be worth checking this free detailed graph of ISEC Healthcare’s past earnings, as well as revenue and cash flows to get a deeper insight into the company’s performance.
Have feedback on this article? Concerned about the content? Get in touch with us directly. Alternatively, email editorial-team (at) simplywallst.com.
This article by Simply Wall St is general in nature. We provide commentary based on historical data and analyst forecasts only using an unbiased methodology and our articles are not intended to be financial advice. It does not constitute a recommendation to buy or sell any stock, and does not take account of your objectives, or your financial situation. We aim to bring you long-term focused analysis driven by fundamental data. Note that our analysis may not factor in the latest price-sensitive company announcements or qualitative material. Simply Wall St has no position in any stocks mentioned.