The Crypto Market Cap (TOTALCAP) broke down from a parallel channel, while Bitcoin (BTC) and SUI fell after rejections.
In the news today:
TOTALCAP Finally Breaks Down
The cryptocurrency market cap has traded inside an ascending parallel channel since December 2023. Such channels often contain corrective movements.
The channel’s resistance trend line rejected the price on January 11 (red icon) and has fallen since. Yesterday, TOTALCAP broke down from the channel’s support trend line.
The trend line also coincides with a long-term horizontal and Fib support level at $1.61 trillion, below which TOTALCAP closed.
If TOTALCAP continues to fall, it can decrease by another 12.60% to the closest support at $1.40 trillion.
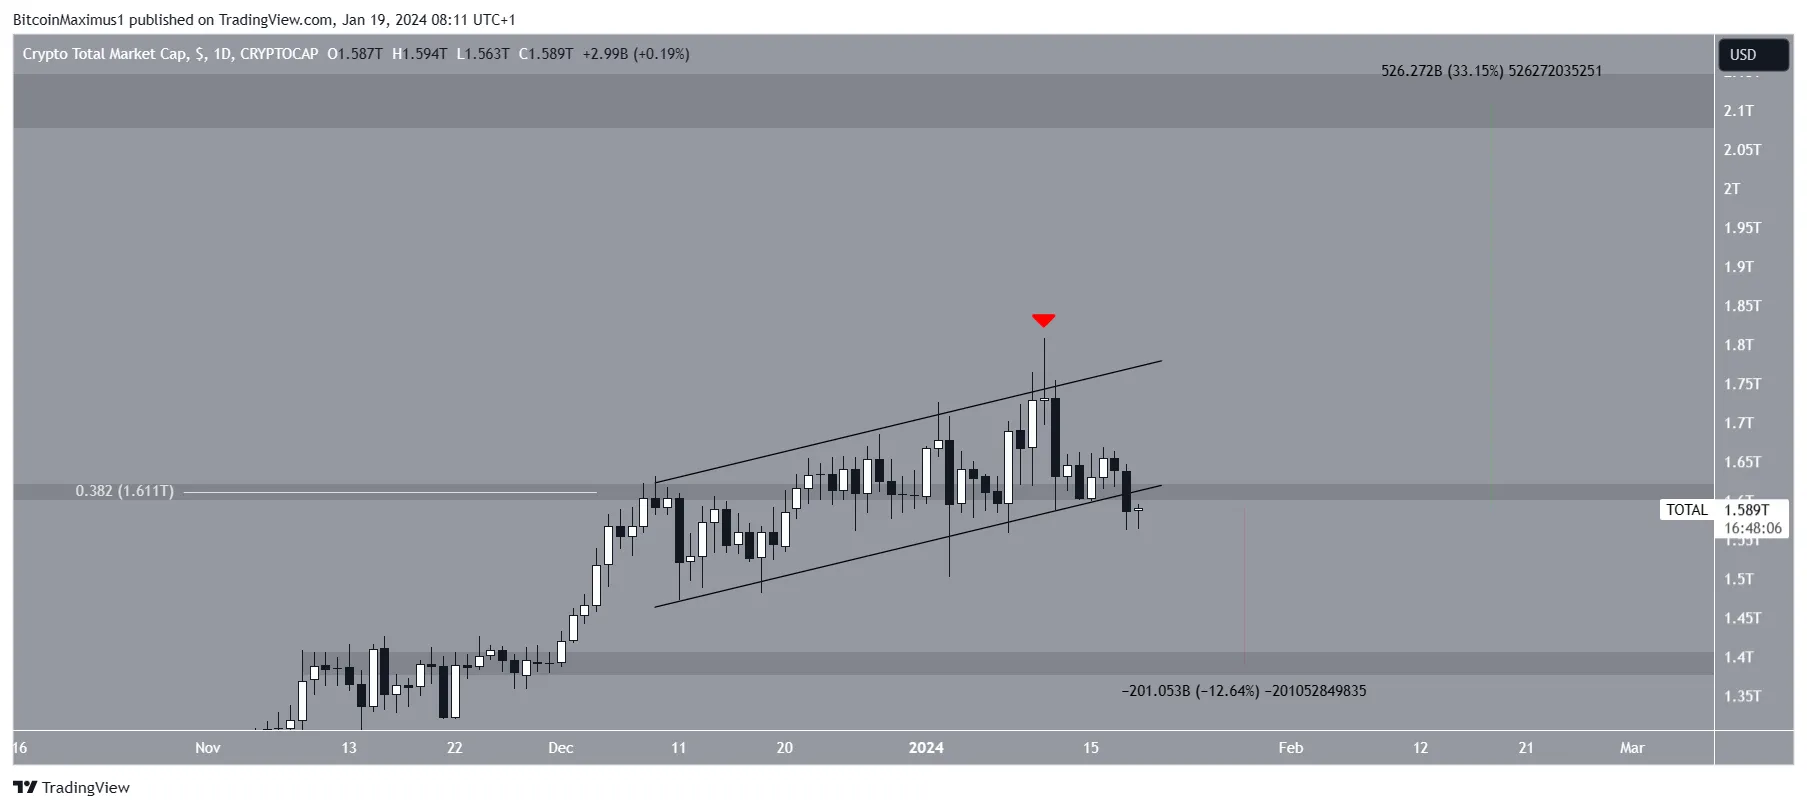
Despite this bearish TOTALCAP prediction, reclaiming the $1.61 trillion area and the channel’s support trend lien can trigger a 33% increase to the next resistance at $2.10 trillion.
Read More: Where to Trade Bitcoin Futures
Bitcoin Falls After Breakdown
Like TOTALCAP, the BTC price had traded inside an ascending parallel channel since December. However, BTC broke down from the channel on January 12, 2024. This is a sign that the upward movement has ended.
After a rejection from the channel’s support trend line on January 16, BTC resumed its downward movement yesterday, falling to a low of $40,705.
If the decrease continues, BTC can fall 9% to the closest support area at $38,000.
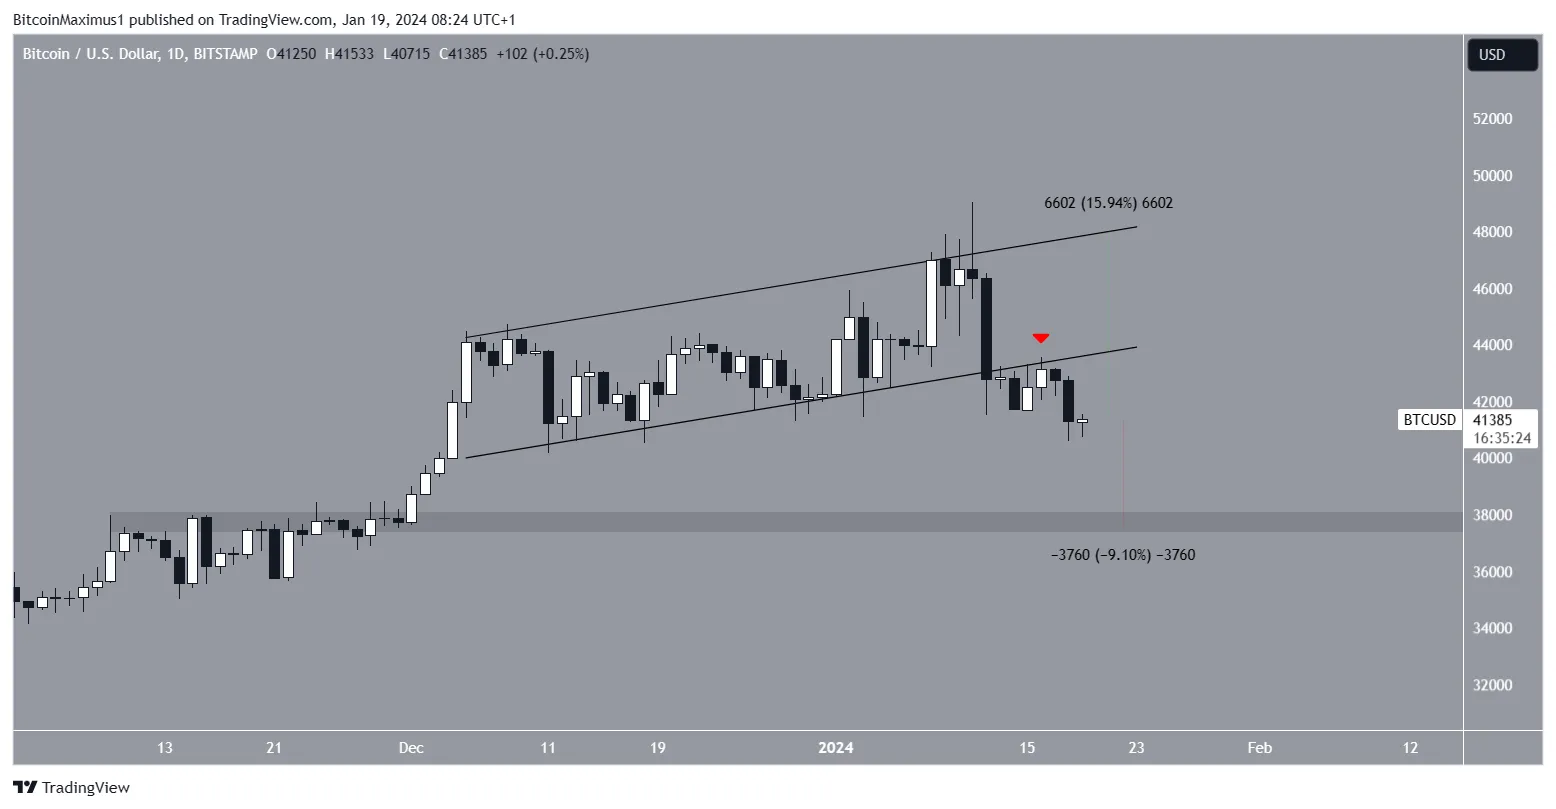
Despite this bearish BTC price prediction, reclaiming the channel’s support trend line will result in a reversal. Then, BTC can increase by nearly 136% to the channel’s resistance trend line at $48,250.
Read More: What is a Bitcoin (BTC) ETF?
SUI Falls Before All-Time High
The SUI price has increased rapidly since the start of the year. The increase led to a high of $1.45 on January 15. However, SUI was rejected by the $1.40 resistance area and has fallen since. The rejection occurred before SUI reached a new all-time high.
If the decrease continues, SUI can fall 20% to the closest support area at $0.90.
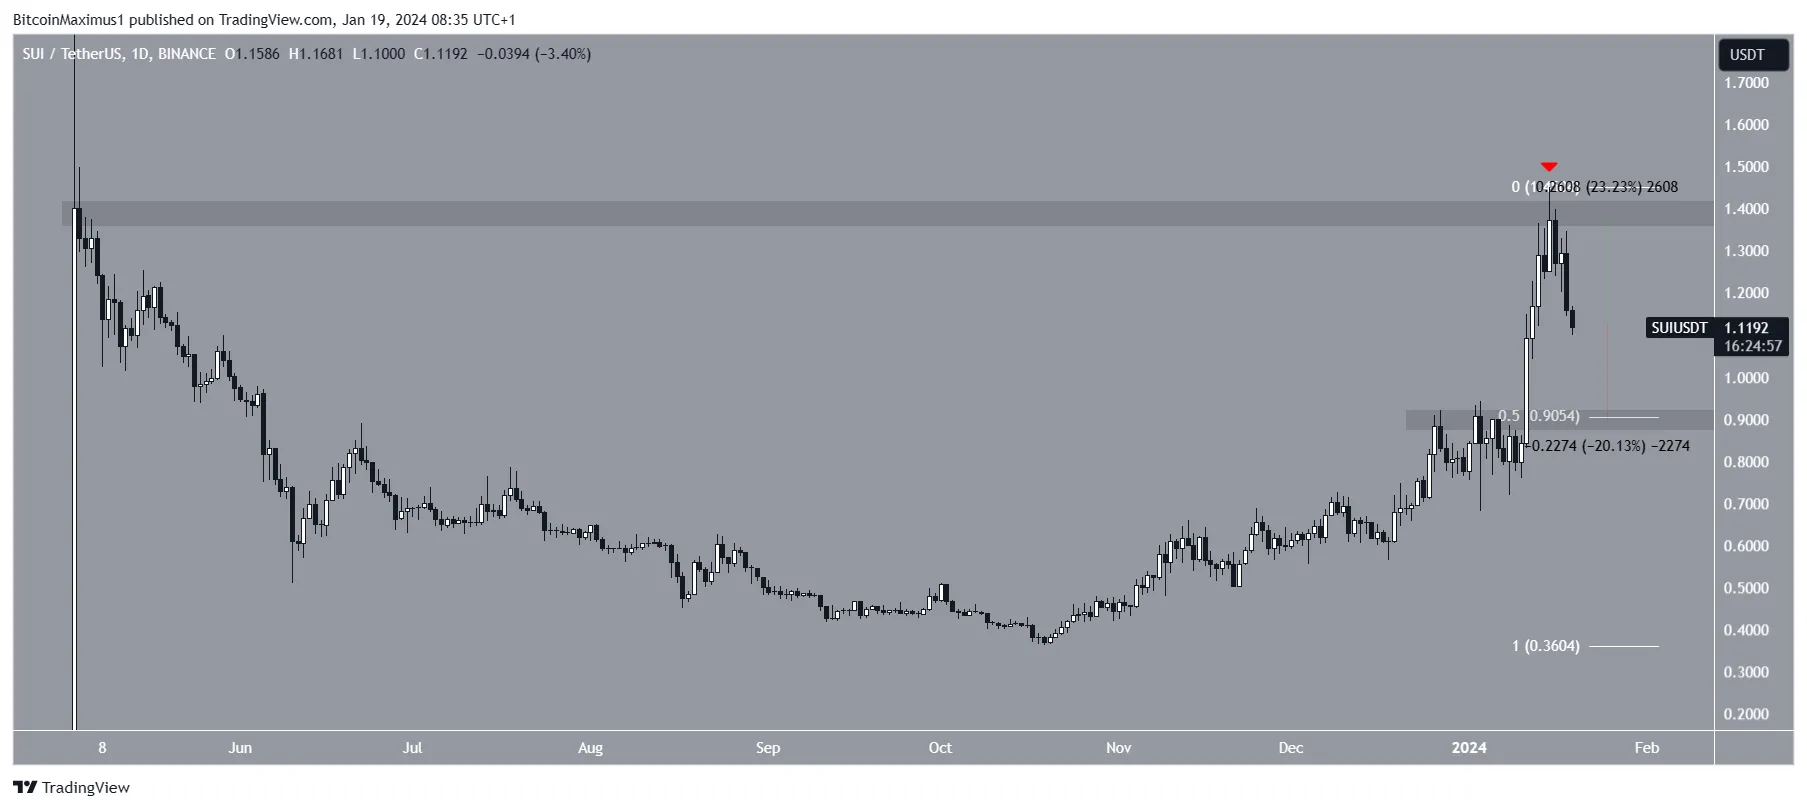
Despite this bearish SUI price prediction, a strong bounce at the current level can trigger a 23% increase to the next resistance at $1.40.
For BeInCrypto‘s latest crypto market analysis, click here.
Disclaimer
In line with the Trust Project guidelines, this price analysis article is for informational purposes only and should not be considered financial or investment advice. BeInCrypto is committed to accurate, unbiased reporting, but market conditions are subject to change without notice. Always conduct your own research and consult with a professional before making any financial decisions. Please note that our Terms and Conditions, Privacy Policy, and Disclaimers have been updated.