Americans owe about $1.7 trillion in student debt. That’s more than for any other category of loans aside from mortgages.
While the total owed has skyrocketed over the past three decades, new student debt has actually been receding in recent years. Indeed, the annual amount students take on in debt has declined steadily since enrollment in higher education peaked in 2010.
Still, more than 43 million Americans today have outstanding student loans. Among those who have debt, the median amount per household is about $25,000, according to the Federal Reserve’s Survey of Consumer Finances. (The average student debt balance by household is around twice as high — at nearly $47,000 — due to a relatively small share of Americans with six-figure debts pulling up the mean figure.)
Read on for more information on who has student debt, the typical debt by degree type, how Americans are repaying their debt and more.
Who’s carrying student debt?
The media attention on student debt might lead you to think it’s more common than it actually is. About 1 in 5 American adults has educational debt. That’s a far lower incidence than the 40% of households who have a mortgage and the 35% who have an auto loan.
That gap is partially because many Americans don’t attend postsecondary education. And even among those who do, many don’t borrow money in order to do so. Roughly four in 10 bachelor’s degree recipients graduate without debt.
That said, it’s undoubtedly true that taking out a student loan is a common American experience. Read on for a deeper dive into who those debtors are.
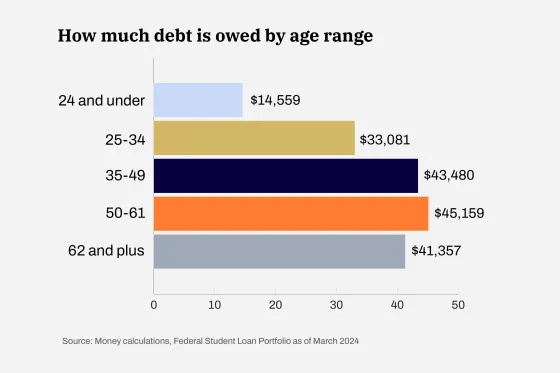
Student debt by age
Perhaps unsurprisingly, most people with student debt — about two-thirds of them — are between the ages of 25 and 50. This group also owes the most, federal statistics show. That said, the fastest growing group of borrowers in the past several years has actually been older adults.
There are 2.7 million borrowers who are 62 or older, a figure that is up by 59% since 2017. Borrowers aged 50 and up now carry 25% of the nation’s student debt, which is more than double the share they held 20 years ago. That growth captures debt for their own degrees, particularly for adults who went back to school, and from loans taken out to fund a child’s education.
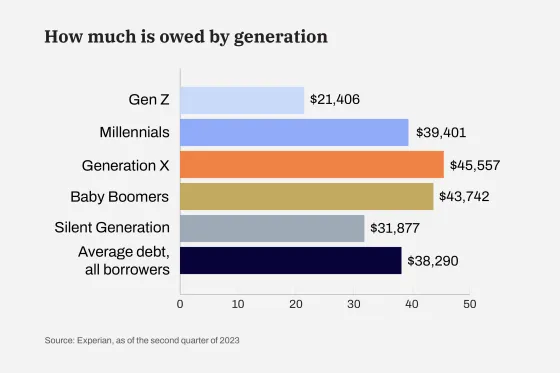
Student debt by generation
Federal statistics don’t break down student debt by generation. Yet data from the credit bureau Experian reveals a generational breakdown that tracks the age statistics reported by the government. That is, Gen X — or Americans aged between 44 years and 59 years in 2024 — hold the most student debt, followed by Baby Boomers (aged 60-78) and Millennials (28 to 43)
Some research has suggested that the youngest borrowers, Gen Z Americans (aged 12-27 years in 2024), are more debt-averse when it comes to student loans than previous generations, which could partially explain their lower average debt burden. But many who are captured in the Gen Z data may not be done with their education – or with borrowing to fund it. They might still be in college or could eventually re-enroll to earn a graduate degree.
Individuals in the Gen Z and Baby Boomer groups, meanwhile, might still be holding debt from their own education or from borrowing for their child’s education (or both). The same may apply for the Silent Generation (79 and older), whose student debt averages over $30,000.
Note that these statistics are based on 2023 numbers, and it’s not clear the extent to which recent efforts by the Biden administration to forgive student debt may have changed the figures. Part of the administration’s latest pitch for debt forgiveness, which is still facing legal challenges, calls for wiping out the balances of borrowers who’ve held debts for 20 years or longer, which could shift the balances of some older generations.
Student debt by race
As with other types of financial products, the use and outcomes associated with student debt look different when you break the data down by race.
Black borrowers carry higher average balances than their white peers; they also tend to take longer to pay off the debt. Hispanic students, on the other hand, tend to be much more debt-averse than their peers, which can be seen in the lower share of Hispanic households with debt and their more modest average balance. One report found that even though these students borrow less, they still report feeling more stressed about debt than their white peers.
Here’s the average student debt according to racial group, along with the proportion of households who are carrying such debt. Data reflects all age groups for those who are carrying student debt.
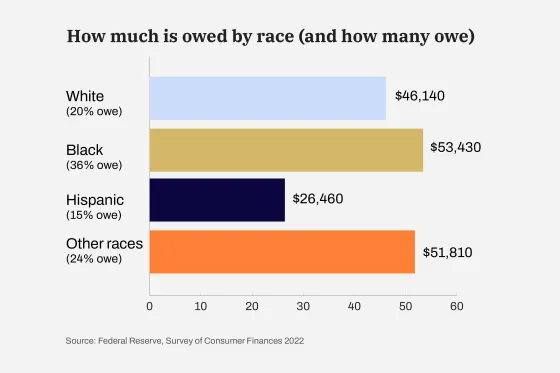
The share of white and Hispanic households holding student debt has been relatively steady since 2010; depending on the year, 18% to 20% of white households have held student debt, along with 14% to 15% of Hispanic households.
That’s not the case with Black families, as data from the Federal Reserve’s Survey of Consumer Finances shows. In 2010, 24% of Black households held student debt. In 2022, the share had climbed to 36%. The typical student debt by household for Black borrowers also climbed faster than for other racial groups in that time period.
A large cadre of research now shows that student debt disproportionately burdens Black borrowers. Not only are Black students more likely to borrow, and to need to borrow more, but they struggle much more with paying back their loans. For example, 30% of Black college graduates with federal student loans report having defaulted at least once, compared to just 10% of white graduates, the Federal Reserve Bank of Richmond reports. An earlier study found that Black college graduates are more likely to default than white college dropouts.
Student debt by gender
Women have outnumbered men on college campuses for decades now. So it makes sense that women, overall, hold more student debt than men, because there are simply more women who attend college and therefore more women who borrow.
But women also have higher debt balances than men who’ve earned the same degree. Women with a bachelor’s degree leave college with $2,700 more in loans than men, according to the American Association of University Women. Women also take about two years longer to repay student loans.
Black women are doubly burdened: One report found about 43% of Black women who had enrolled in some type of postsecondary education had student loan debt in 2022. That’s compared to 19% of white women and 15% of white men.
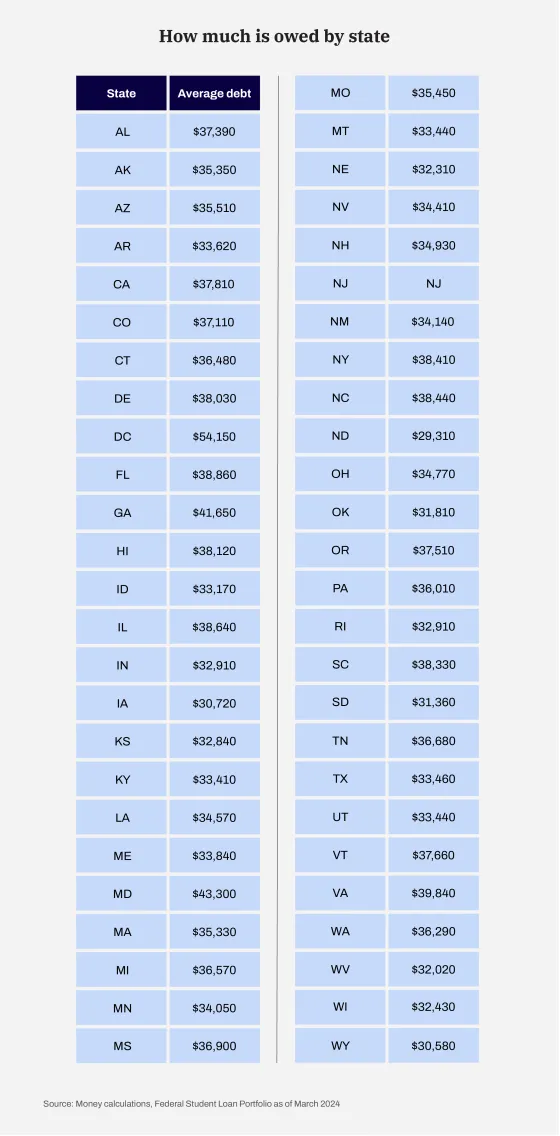
Student debt by state
Cities that are home to a high share of workers with advanced degrees tend to have higher student debt balances, as you’d expect. But state-by-state borrowing averages are harder to make generalizations about, since the options for affordable education, availability of state financial aid and the cost of living after college can all play a role in how much residents borrow and how they’re able to pay it down.
That said, many of the states with the highest average debt balances are on the East Coast, while those with the lowest balances tend to be in the middle of the country.
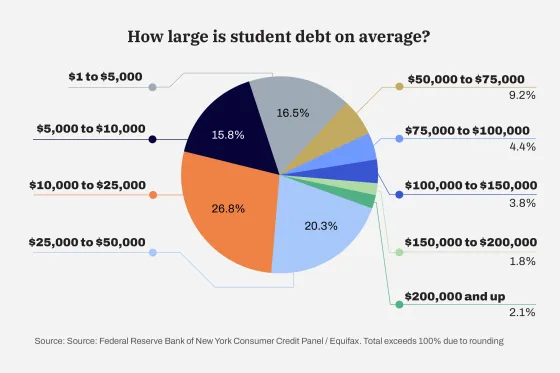
Student loan borrowers by balance owed
Most borrowers actually have relatively small debt balances. More than 30% of borrowers, for example, owe less than $10,000, while less than 8% of borrowers owe more than $100,000.
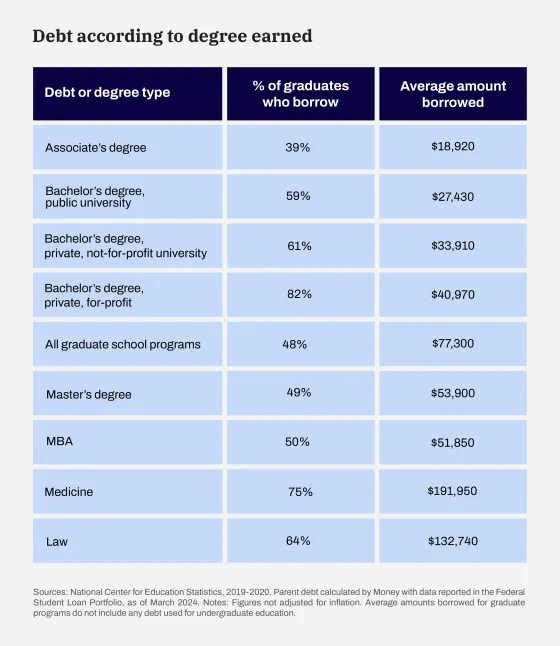
Average student debt by degree
Debt varies widely by the level and type of degree earned, with professional degrees, including medical, law, dentistry and veterinary degrees, routinely topping the list of graduates with the largest debt burdens. Even within a specific degree, debt can vary based on school type. The overall average for a bachelor’s degree, for example, is $30,500, but the average at for-profit colleges is higher than that at traditional public and private colleges.
How are borrowers repaying their student loans?
When federal borrowers enter repayment, they’re placed in the “standard” repayment plan, which is a 10-year term with all monthly payments equal.
In reality, most borrowers take longer than 10 years to get rid of their debt, either through paying it off in full or qualifying for some type of forgiveness. One estimate, from financial aid expert Mark Kantrowitz, puts the typical loan pay-off time at between 16 and 19 years.
Before the pandemic student loan payment pause, the median monthly payment was between $200 and $299, according to the Federal Reserve. Some 40% of borrowers who are paying back their student loans are in repayment plans that tie their monthly payments to how much they earn and offer loan forgiveness for any outstanding balance after a certain number of payments have been made.
Here’s a snapshot of how borrowers are repaying their loans, per federal statistics.
- 25.4 million: # of borrowers in repayment
- 12.5 million: # of borrowers in repayment are in an income-driven repayment plan
- 5.2 million: # of borrowers in deferment or forbearance
- 7.1 million: # of borrowers are delinquent
Note: The list above only captures borrowers with federal Direct Loans. Borrowers with older loans from the Federal Family Education Loan Program are not included.
Private student loan statistics
More than 90% of outstanding student debt in America is federal debt. But there are students and parents who turn to private student loans every year to fill in the gaps left after federal financial aid is tapped.
During the 2022-2023 school year, families borrowed more than $10 billion in private loans. That’s a 6.7% increase from the year before, according to Enterval, a lending analytics firm. The average private student loan balance is just over $13,000, Enterval’s data show. In all, Americans hold an estimated $130 billion in private student debt.
More from Money:
These Are the Best Colleges in America
Down Payment vs. Student Loans: How to Decide Where to Put Your Money
5 Steps to Get a Student Loan for College
© Copyright 2024 Money Group, LLC. All Rights Reserved.
This article originally appeared on Money.com and may contain affiliate links for which Money receives compensation. Opinions expressed in this article are the author’s alone, not those of a third-party entity, and have not been reviewed, approved, or otherwise endorsed. Offers may be subject to change without notice. For more information, read Money’s full disclaimer.
The views and opinions expressed herein are the views and opinions of the author and do not necessarily reflect those of Nasdaq, Inc.