Unfortunately, investing is risky – companies can and do go bankrupt. On the other hand, if you find a high quality business to buy (at the right price) you can more than double your money! For example, the IOI Properties Group Berhad (KLSE:IOIPG) share price had more than doubled in just one year – up 125%. And in the last month, the share price has gained 15%. And shareholders have also done well over the long term, with an increase of 95% in the last three years.
So let’s investigate and see if the longer term performance of the company has been in line with the underlying business’ progress.
Check out our latest analysis for IOI Properties Group Berhad
There is no denying that markets are sometimes efficient, but prices do not always reflect underlying business performance. One imperfect but simple way to consider how the market perception of a company has shifted is to compare the change in the earnings per share (EPS) with the share price movement.
During the last year, IOI Properties Group Berhad actually saw its earnings per share drop 54%.
Given the share price gain, we doubt the market is measuring progress with EPS. Therefore, it seems likely that investors are putting more weight on metrics other than EPS, at the moment.
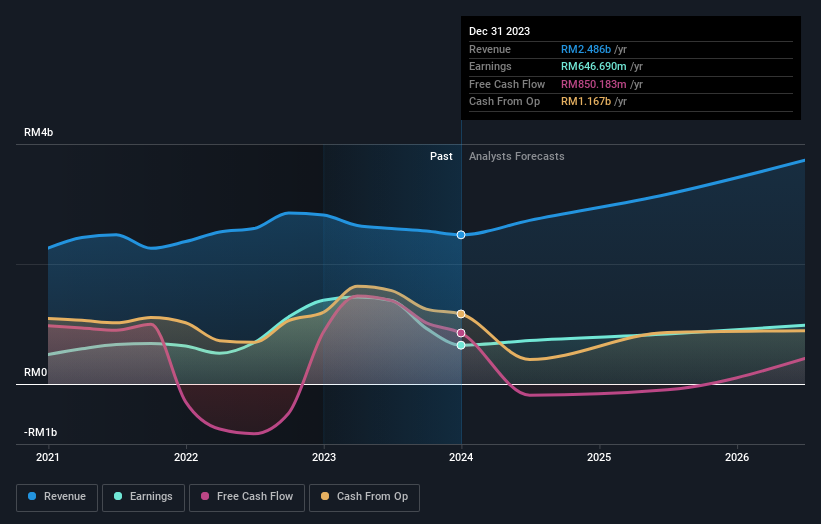
IOI Properties Group Berhad’s revenue actually dropped 12% over last year. So the fundamental metrics don’t provide an obvious explanation for the share price gain.
The image below shows how earnings and revenue have tracked over time (if you click on the image you can see greater detail).
We’re pleased to report that the CEO is remunerated more modestly than most CEOs at similarly capitalized companies. It’s always worth keeping an eye on CEO pay, but a more important question is whether the company will grow earnings throughout the years. So we recommend checking out this free report showing consensus forecasts
What About Dividends?
When looking at investment returns, it is important to consider the difference between total shareholder return (TSR) and share price return. Whereas the share price return only reflects the change in the share price, the TSR includes the value of dividends (assuming they were reinvested) and the benefit of any discounted capital raising or spin-off. It’s fair to say that the TSR gives a more complete picture for stocks that pay a dividend. As it happens, IOI Properties Group Berhad’s TSR for the last 1 year was 133%, which exceeds the share price return mentioned earlier. And there’s no prize for guessing that the dividend payments largely explain the divergence!
A Different Perspective
It’s good to see that IOI Properties Group Berhad has rewarded shareholders with a total shareholder return of 133% in the last twelve months. And that does include the dividend. That gain is better than the annual TSR over five years, which is 16%. Therefore it seems like sentiment around the company has been positive lately. In the best case scenario, this may hint at some real business momentum, implying that now could be a great time to delve deeper. I find it very interesting to look at share price over the long term as a proxy for business performance. But to truly gain insight, we need to consider other information, too. To that end, you should learn about the 3 warning signs we’ve spotted with IOI Properties Group Berhad (including 1 which is potentially serious) .
We will like IOI Properties Group Berhad better if we see some big insider buys. While we wait, check out this free list of undervalued stocks (mostly small caps) with considerable, recent, insider buying.
Please note, the market returns quoted in this article reflect the market weighted average returns of stocks that currently trade on Malaysian exchanges.
Have feedback on this article? Concerned about the content? Get in touch with us directly. Alternatively, email editorial-team (at) simplywallst.com.
This article by Simply Wall St is general in nature. We provide commentary based on historical data and analyst forecasts only using an unbiased methodology and our articles are not intended to be financial advice. It does not constitute a recommendation to buy or sell any stock, and does not take account of your objectives, or your financial situation. We aim to bring you long-term focused analysis driven by fundamental data. Note that our analysis may not factor in the latest price-sensitive company announcements or qualitative material. Simply Wall St has no position in any stocks mentioned.