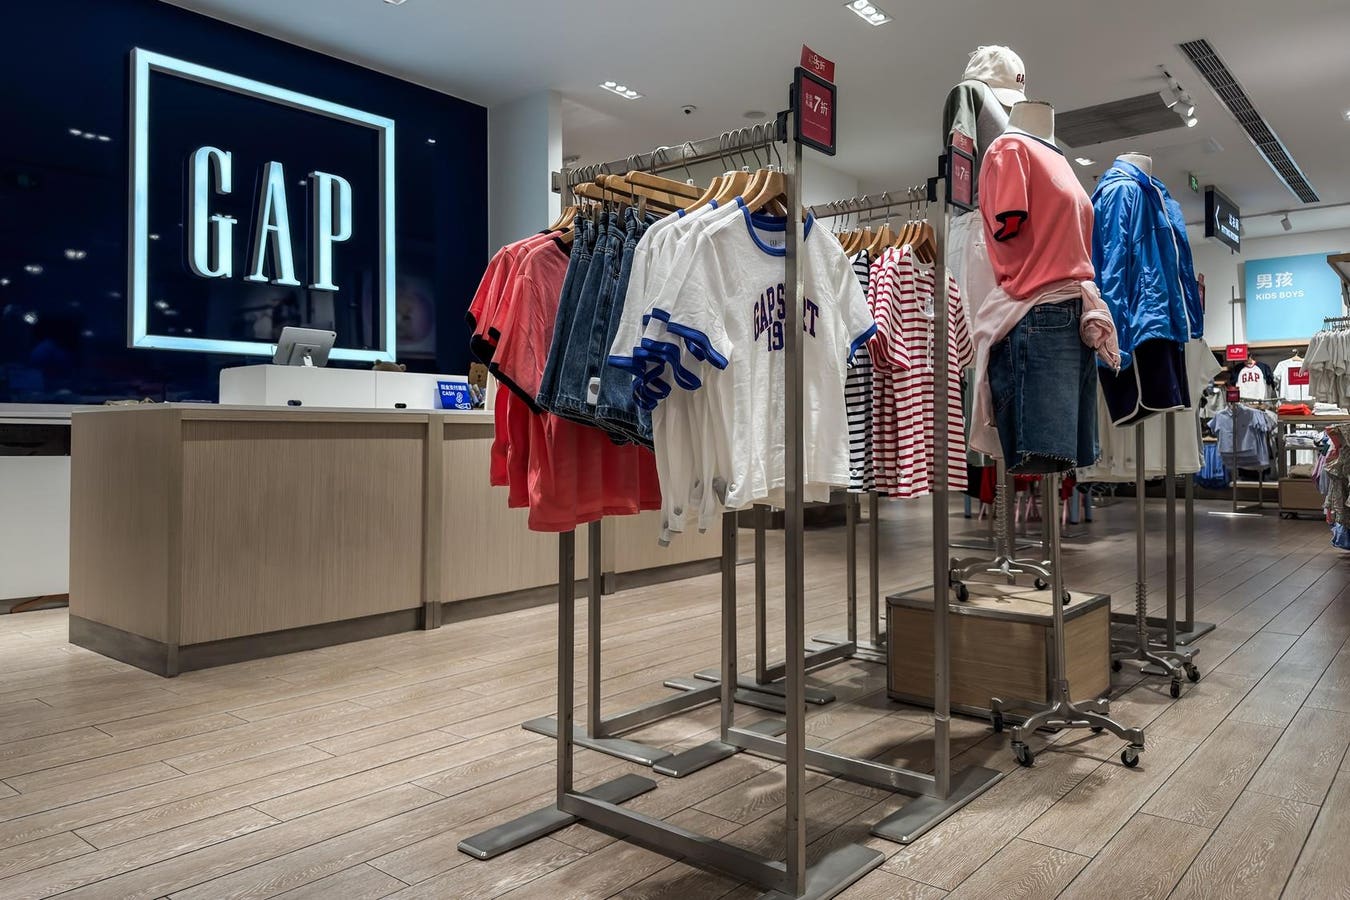
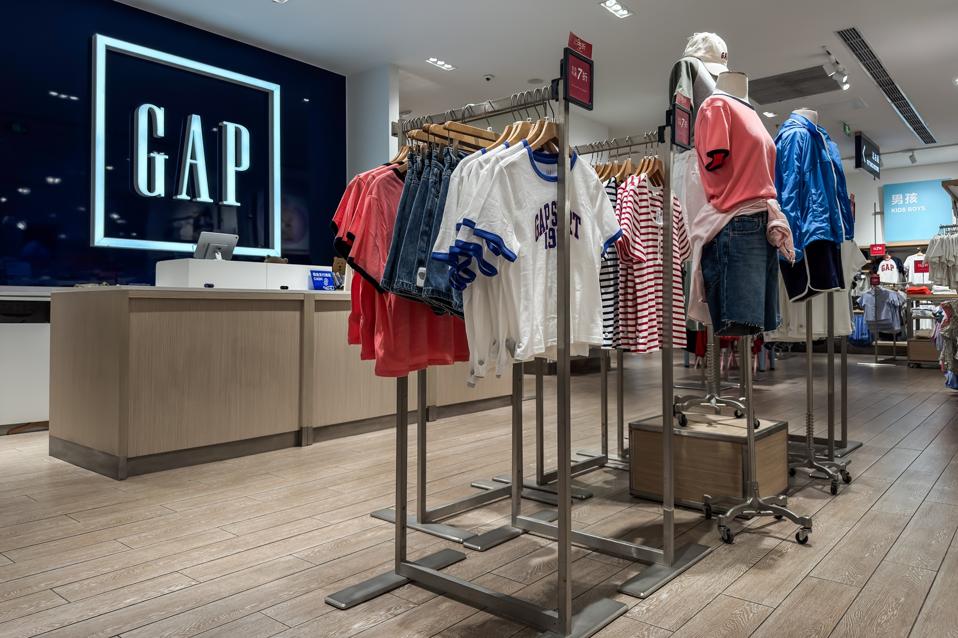
CHONGQING, CHINA – MAY 31: A view inside a GAP retail store shows children’s clothing on racks near … More
Note: Gap’s fiscal year concluded on February 1, 2025
Despite a surprisingly robust Q1, investors are avoiding Gap Inc. stock (NYSE: GAP) — and for valid reasons. Although the stock appears inexpensive at first glance, with valuation indicators significantly lower than the overall market, underlying problems are affecting sentiment: resurgence of tariff concerns, stagnant forward guidance, and tenuous consumer confidence. The outcome? A 6.1% decline on July 14, even as the S&P 500 managed a 0.1% increase and rival Guess (NYSE: GES) fell just 1%. For those in pursuit of more stable long-term growth, diversified approaches like the Trefis High Quality portfolio have yielded over 91% returns since inception and provide a smoother journey. Separately see – Trump’s Russia Math, Simplified
What Is Affecting Gap?
The selloff was a follow-up to a brief rally after earnings, but enthusiasm diminished swiftly. In its Q1 report, Gap disclosed full-year gross tariff costs between $250–$300 million, with $100–$150 million impacting the bottom line despite mitigation efforts. This risk became increasingly tangible following recent court decisions that allowed for the reinstatement of Trump-era tariffs. Additionally, Gap forecasted flat revenue in Q2, a warning sign for a firm attempting to demonstrate it has shifted direction.
Consumer Confidence: A Weak Spot
Consumer sentiment, which is crucial for apparel demand, is on the decline. The U.S. Consumer Confidence Index dropped to 93.0 in June, down from 98.4 in May and significantly lower than its pre-pandemic level of 132.6 in February 2020. A smaller number of Americans anticipate improvements in the job market (15.4%, down from 18.6%) or business conditions (16.7% vs. 19.9%), indicating a weakening environment for spending.
Q1 Overview: Solid, But with Flaws
In Q1 (which concluded on May 3, 2025), Gap reported a 2.2% year-over-year revenue increment to $3.46 billion and earned $0.51 per share, an increase of 24% and surpassing expectations. Gross margin grew to 41.8%, while operating margin improved to 7.7%, boosting net income by 22% to $193 million. Comparable sales rose by 5% for the Gap brand and 3% for Old Navy, but Banana Republic experienced flat comps, and Athleta’s comps dropped about 8%. Online sales increased by 6%, now accounting for 39% of total revenue. Despite holding almost $2 billion in cash, the company reported negative free cash flow of $223 million, reflecting regular seasonal trends. Gap reaffirmed its full-year guidance for 1–2% revenue growth and 8–10% operating income growth, excluding the anticipated tariff impact.
Valuation: Deal or Value Trap?
Gap is trading at a significant discount compared to the broader market, with a price-to-sales ratio of 0.6 (compared to 3.1 for the S&P 500), a price-to-free cash flow of 9.9 (vs. 20.9), and a price-to-earnings of 9.4 (vs. 26.9). While these numbers imply a bargain, they also reflect investor skepticism regarding the company’s fundamentals and long-term growth prospects.
Growth & Profitability: Mixed Signals
Over the last three years, Gap’s revenue has contracted at an average annual rate of 2.1%, in contrast to the S&P 500’s 5.5% increase. Sales have remained stable over the past year, and Q1’s 2.2% revenue growth remains modest. Profitability continues to lag behind its peers, with an operating margin of 7.7%, a net margin of 5.8% (versus 11.6% for the S&P 500), and an operating cash flow margin of 8.7% (versus 14.9%). Although operational execution is improving, Gap is still significantly trailing industry leaders.
Gap’s balance sheet is sound but not flawless. The company has $5.5 billion in debt compared to an $8 billion market cap, leading to a debt-to-equity ratio of 63.4%, which is over three times the S&P 500 average. On a positive note, a healthy cash-to-assets ratio of 19.2% provides a buffer as the company navigates cost pressures and ongoing brand transformation.
Final Thoughts
Indeed, Gap appears inexpensive. However, there’s a reason for it. The Q1 performance is promising, but investors are justifiably wary given the tariff risks, lukewarm guidance, uneven brand performance, and a deteriorating consumer environment. Until the fundamentals show broader improvement, the discount may persist.
Investing in a single stock carries risks. For those seeking growth with lower volatility, diversified portfolios such as the Trefis High Quality portfolio present an attractive alternative. Why is that? As a group, HQ Portfolio stocks have delivered superior returns with lesser risk compared to the benchmark index, leaning away from extreme fluctuations, as illustrated in HQ Portfolio performance metrics.


