
By Scott Kennedy, Produced with Colorado Wealth Management Fund
Introduction
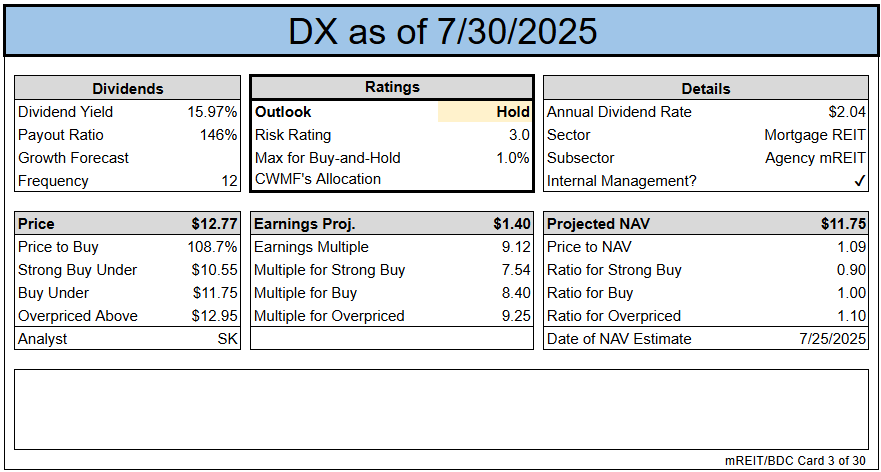
DX remains a Hold with a risk rating of 3. Q2 came in as expected: A small BV beat (1.6%) and core earnings right on target. Strong capital raises and timely MBS purchases helped offset early-quarter volatility. ERTI is still close to covering the dividend, but any sustained shortfall could pressure payouts later in 2025.
Dynex Capital
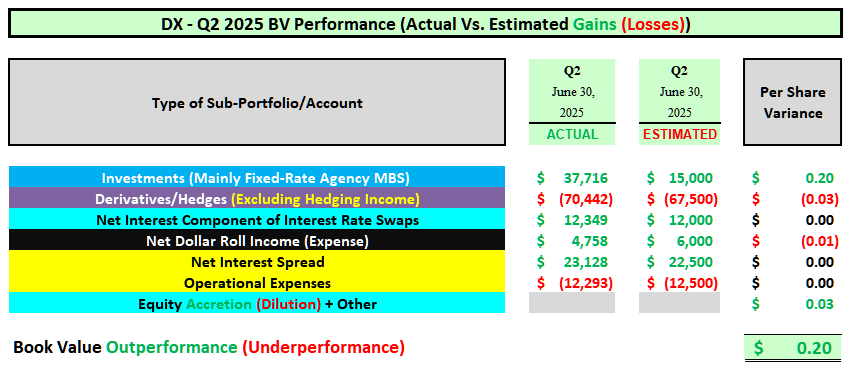
- Quarterly BV Fluctuation: Minor Outperformance (1.6% Variance).
- Core Earnings/EAD: Basically an Exact Match (Only a $0.002 Variance).
A largely “as expected” quarter regarding Dynex Capital’s BV in my opinion. If anything, a minor outperformance. DX recorded a modest quarterly BV decrease which largely matched my expectations. Remember, Q2 2025 was a very volatile quarter for agency mREIT stocks regarding BV fluctuations. Most agency sub-sector peers reported a modest – notable decrease in BV during early April 2025. However, a partially mitigating BV increase occurred during late June 2025 as spread/basis risk began to decline towards the end of the quarter. This was correctly projected/discussed as this occurred during the quarter in our weekly newsletter/article series. As such, I believe DX’s 1.6% BV variance versus my projection was pretty accurate due to the volatile swings in BV during Q2 2025.
During April 2025, as a direct result of the current administration’s proposed tariff policies, markets briefly went into “crisis mode.” Usually, U.S. Treasury and agency MBS markets are “safe havens” in times of market volatility. However, that was not the case during early April 2025. In fact, there was a spike in mortgage interest rates and U.S. Treasury yields as pricing quickly declined. For some select agency mREIT peers, this directly resulted in varying severities of agency MBS margin calls. However, regarding DX, due to the company’s amble cash reserves and at-the-market (“ATM”) common stock equity issuance, this agency mREIT peer was “spared” regarding any measurable margin calls. In the end, this helped DX when compared to some other sub-sector peers (for instance ORC). As markets quickly calmed down, as a direct result of trade negotiations, tariff delays, and less perceived risks to the U.S. economy, both the stock market and MBS pricing rebounded during most of May 2025. However, in late May 2025, fears began to spread within U.S. Treasury and agency MBS markets again due to talk/rhetoric of ending Fannie Mae’s and Freddie Mac’s conservatorship (previously discussed in an article in late May 2025). Simply put, initially more fear/uncertainty. However, as fears around this event subsided, U.S. Treasury and agency MBS pricing quickly increased by late June 2025.
As DX’s stock price traded above current BV during Q2 2025, management very aggressively raised capital and put most of said capital to use by the end of the quarter. This particularly benefited DX to some degree as management was very aggressive regarding both on- and off-balance sheet MBS purchases (which quickly increased in price in late June 2025). DX increased the company’s on- and off-balance sheet MBS by 25% and 33% during Q2 2025, respectively. In comparison, I projected an on- and off-balance sheet MBS quarterly increase of 15% and 20%, respectively. As such, the overall valuation fluctuations within DX’s MBS/investment portfolio were slightly – modestly more enhanced to what I projected during Q2 2025 (see table below; first row of accounts). This directly led to the vast majority of DX’s 1.6% BV outperformance when compared to my expectations.
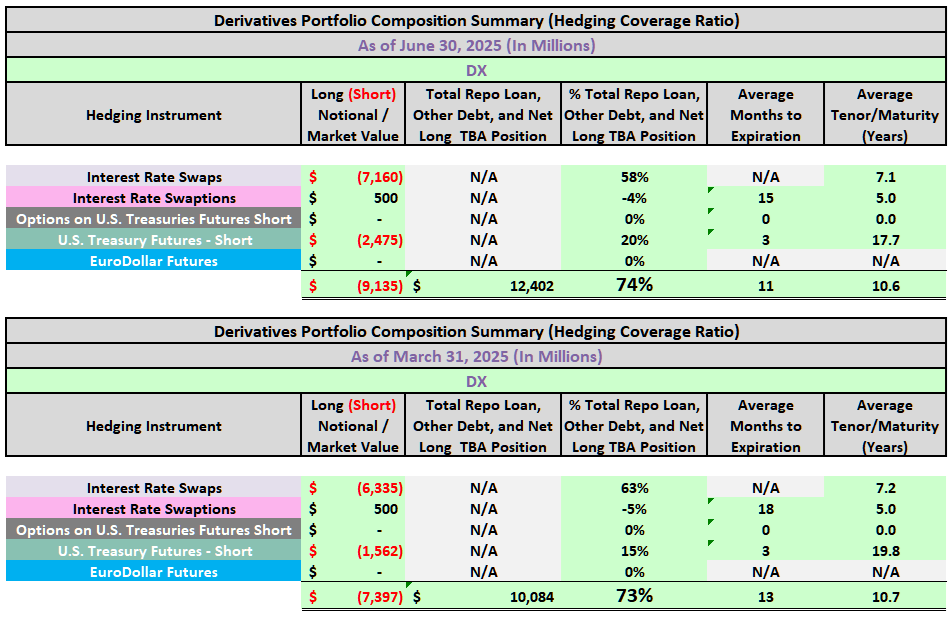
As anticipated, DX increased the company’s derivatives sub-portfolio during Q2 2025. However, there were no notable changes to the ratio of (short) U.S. Treasury futures and interest rate payer swaps during the quarter. Simply put, DX basically added a similar/proportionate share to both instruments during Q2 2025. This was correctly anticipated. Remember, during Q3 – Q4 2024, DX quickly transitioned away from most of the company’s (short) U.S. Treasury futures and purchased interest rate payer swap contracts which was surprising at the time. However, during Q1 2025, I largely correctly anticipated the lack of notable compositional changes between these two derivatives instruments. DX also maintained a very similar weighted average tenor/maturity during Q2 2025 which was correctly anticipated. If anything, DX added a bit more (short) derivative instruments when compared to my expectations but this was largely offset by the larger net long off-balance sheet TBA MBS position discussed in the paragraph above (see table below; second row of accounts). DX maintained the company’s minor interest rate receiver swaptions position.
Moving on, I correctly projected DX’s core earnings/EAD would continue to improve which remains a step in the right direction in my opinion. This was mainly due to a combination of the following during Q2 2025: 1) net interest income basically matched expectations (a modestly larger MBS balance, a slight move higher in MBS coupon, and a fractional increase in borrowing costs); 2) NDR income slightly underperformed expectations (a larger quarterly TBA MBS balance but lack of movement into lower coupons with larger price drops); 3) current period hedging income largely matched expectations (directly due to a larger interest rate payer swaps sub-portfolio); and 4) operational expenses largely matched expectations. Per share variances of these 4 accounts/factors are provided in the table below (see third – sixth row of accounts).
I believe DX’s BV fluctuation during Q2 2025 will be near – slightly outperform the agency mREIT sub-sector peer average. I also believe the size of DX’s core earnings/EAD increase during Q2 2025 will slightly outperform the agency mREIT sub-sector peer average. This overall very slight – slight outperformance was already projected/considered when considering DX’s current risk/performance rating and percentage recommendation ranges.
A risk/performance rating of 3 for DX remains appropriate in the current environment/over the foreseeable future. Remember, even though most agency mREITs have very little credit risk, these companies still have to navigate the following risks: 1) spread/basis; 2) leverage; 3) prepayment/extension; and 4) interest rate (regarding derivatives). As a reminder, my/our models continue to project 1 – 2 (25) basis point (“bp”) Federal (“Fed”) Funds Rate cuts at some point during the 2nd half of 2025. This is already “baked” into current sector recommendation ranges/price targets.
The REIT Forum
Change or Maintain
- BV/NAV Adjustment (BV/NAV Used Interchangeably): Our projection for current BV/NAV per share was adjusted: Up $0.20 (To Account for the $0.20 Actual 6/30/2025 BV/NAV Vs. Prior Projection + $0.00 BV Fluctuation Thus Far in July 2025 Due to Portfolio Compositional Changes Vs. Modeling Assumptions [Factoring in the July 2025 Dividend]). Price targets have already been adjusted to reflect the change in BV/NAV. The update is included in the card below and the subscriber spreadsheets.
- Percentage Recommendation Range (Relative to CURRENT BV/NAV): No Change.
- Risk/Performance Rating: No Change. Remains at 3.
Hedging
- Hedging Coverage Ratio: Increase from 73% to 74%.
The REIT Forum
Earnings Results
The REIT Forum
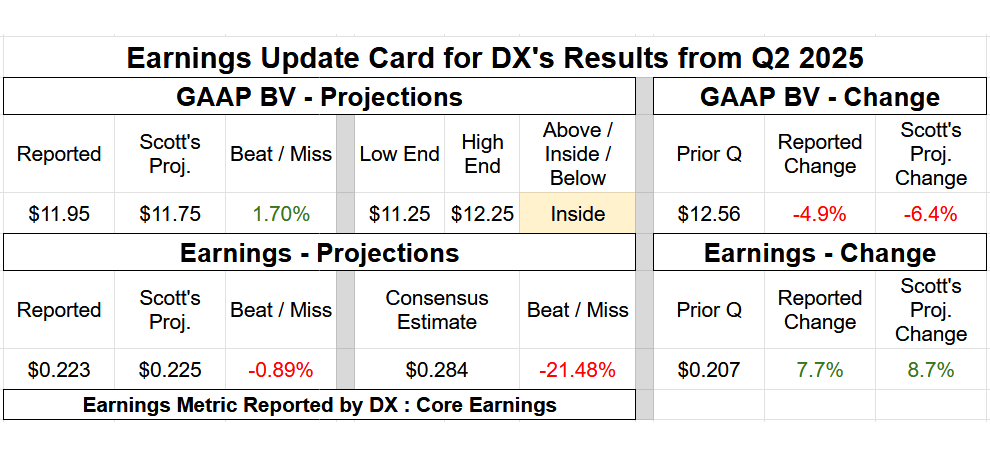
Note: BV at the end of the quarter. Subscriber spreadsheets and targets use current estimates, not trailing values.
Valuation
The REIT Forum
Ending Notes/Commentary
As stated in prior DX earnings assessment articles, there was a notable caveat to the company’s core earnings/EAD metric in the past (a bit less so in the current and projected near-term environment with the fairly recent notable shift in derivative composition; discussed earlier). I would point out the company’s core earnings/EAD metric was previously severely “flawed” when trying to assess dividend sustainability. Simply put, the equivalent to DX’s current period hedging income, through the use of U.S. Treasury futures, is not a part of the company’s core earnings/EAD calculation/metric. Per GAAP, this income equivalent is part of DX’s realized gains (losses) and is excluded from core earnings/EAD. In comparison, per GAAP, current period hedging income from interest rate payer (receiver) swaps is part of a company’s core earnings/EAD calculation/metric. So, in a nutshell, previously a very large portion of DX’s “true” operational income/gains was excluded from core earnings/EAD. This was why DX experienced a very rapid decline in core earnings/EAD during 2022 – 2023. DX chose not to utilize interest rate payer (receiver) swaps in lieu of net (short) U.S. Treasury futures. Very important to understand.
As noted two quarters ago, I was pleased DX provided an ERTI per share figure during the company’s Q4 2024 earnings press release (the actual total ERTI figure/amount; not just the amount assigned to U.S. Treasury futures as there are various/many reconciliations that make up ERTI versus core earnings/EAD). DX projected the company’s 2024 ERTI was $96 million or $1.36 per common share when based on weighted average shares for the year. In comparison, DX’s 2024 core earnings/EAD was ($0.35) per common share. Simply put, a notable difference between the two metrics. DX’s previously disclosed ERTI figure during the company’s Q4 2024 earnings simply proved/factualized the point I had been continuously making over the prior several years (even before management was making this point; ERTI was notably higher vs. core earnings/EAD).
Unfortunately, DX did not provide an ERTI figure in conjunction with Q1 2025 or Q2 2025 earnings. However, based on a very rough calculation, I’m projecting DX’s ERTI figure was approximately $0.49 and $0.45 per common share for Q1 2025 and Q2 2025, respectively. The main reason for the minor Q2 2025 decrease was directly due to the quickly rising weighted average outstanding shares of common stock through rapid equity issuance. When calculated, this was very slightly above DX’s monthly dividends totaling $0.47 per common share during Q1 2025. However, this would be slightly – modestly below DX’s monthly dividends totaling $0.51 per common share during Q2 2025. Nothing too “troubling” at this point but this will be a metric that is closely watched as 2025 progresses.
DX also projected the company’s BV as of 7/18/2025 was relatively unchanged per common share when compared to 6/30/2025. I would point out this projection excludes DX’s July 2025 dividend of $0.17 per common share that, technically, will be recorded on the company’s ex. dividend date of 7/23/2025. After factoring in DX’s Q2 2025 BV outperformance of $0.20 per common share (discussed above), DX’s current BV projection was basically an exact match versus my current BV projection of $11.75 per common share since I’m factoring in the July 2025 common stock dividend this week.
DX is currently deemed to be appropriately valued (hence the HOLD recommendation). Personally, I will be waiting for a modest pullback before considering re-entering DX.