Let’s step back and ignore the last four years in which the economy cratered with the onset of the pandemic and then boomed on massive monetary and fiscal stimulus. Let’s also try to ignore the peak 6% core PCE inflation rate in 2022 and the historically low 3.4% unemployment rate in 2023. What if, in the years preceding the pandemic, we told you that in 2024, the Fed Funds rate would be 5.25-5.50%? You probably would have assumed inflation was at least 5% and the unemployment rate was exceptionally low.
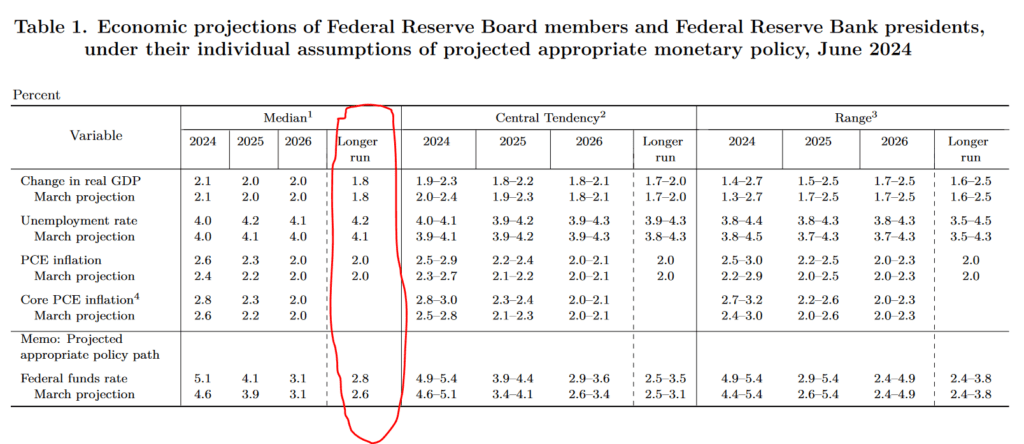
The current unemployment rate is 4%, and the core PCE inflation rate is 2.6%. In December 2019, the unemployment rate was 3.6%, and the core PCE was 1.6%. At the time, Fed Funds were 1.5%. Here we sit today, with the unemployment rate .4% higher and core PCE 1% higher than in 2019. Yet, the Fed Funds rate is 4% more than in 2019. Does it seem a bit high? To help answer the question, consider the Fed’s long-term forecasts.
As we circle below, the Fed thinks the natural long-term unemployment rate is 4.2% and PCE 2.0%. Under such an outlook, the Fed believes Fed Funds should be 2.8%. While it’s hard to make a case for the Fed to cut rates today, a simple look at their two objectives, full employment and stable prices, and its long-term economic projections make one appreciate that the current Fed Funds rate is exceptionally high. Even if the economy continues to chug along without a recession, it appears that barring higher inflation, significant rate cuts in the coming year will be consistent with the Fed’s economic outlook.
What To Watch Today
Earnings
- No notable earnings releases today
Economy


Market Trading Update
As discussed yesterday, this is the beginning of a new quarter, the end of the first half, and the beginning of the Q2 earnings season. We noted that with this holiday-shortened week, volatility could certainly pick up. Unsurprisingly, I received several emails about the sharp sell-off in long-date Treasury bond ETFs. As shown, bond ETFs had a sharp reversal due to end-of-quarter rebalancing and dividend distributions yesterday, temporarily suppressing the price. However, bonds had enjoyed a very nice rally and were overbought going into quarter-end, so the sell-off is unsurprising
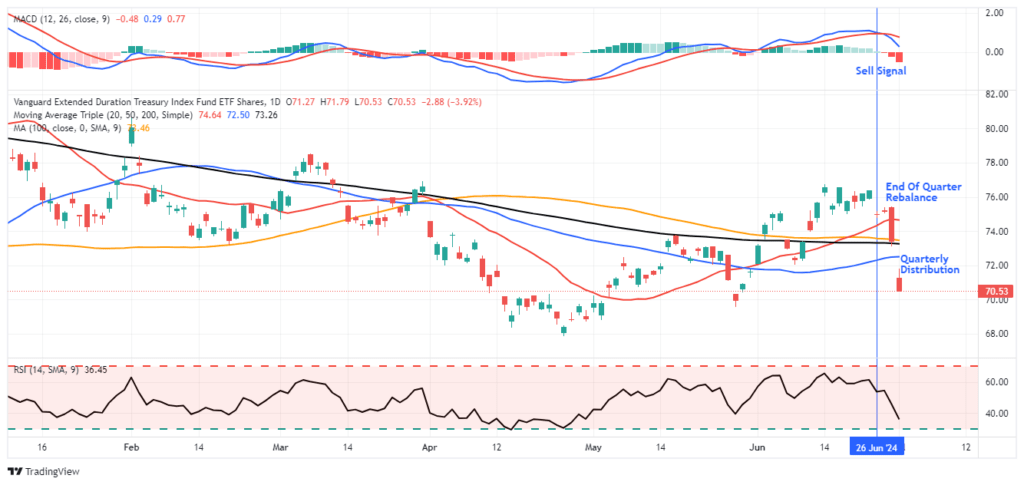

The economic data continues to show economic deterioration, which is bond-supportive, so the recent selloff in bond ETFs is likely presenting a good buying opportunity for traders. The last time bonds approached this level of oversold conditions was in April and May before a decent rally occurred.


Economic Surprise Index
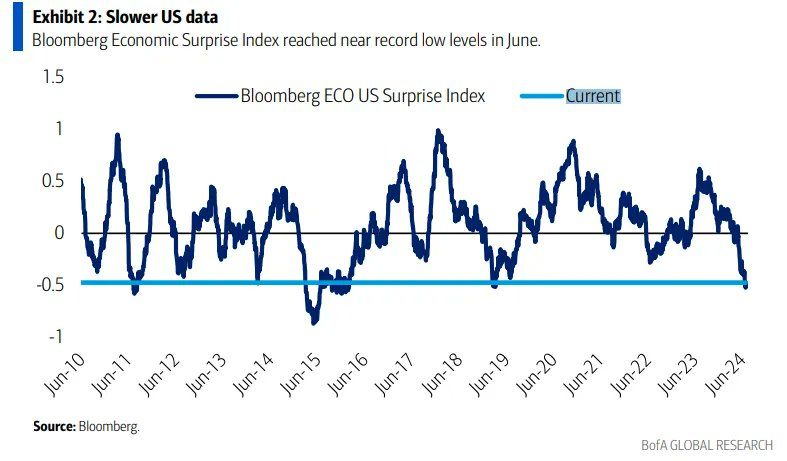
We have read articles warning of an imminent recession due to the low economic surprise index. While we rule nothing out, it’s best to appreciate what the index tells us. Surprise indexes measure specific economic data forecasts versus the actual data. When the surprise index declines, it simply means that economic forecasters are generally overly optimistic. Hence, economic data is weaker than expected. Initially, that typically means the economy is slowing. However, economists are quick to adjust their forecasts for trend changes. Once this occurs, data may still deteriorate, but economists’ forecasts tend to be closer to reality or often overly pessimistic. Frequently, the surprise index will rebound. However, that doesnt mean the economy is improving, it only means forecasts are more realistic.
As shown below, the surprise index tends to oscillate. Low readings can precede a recession, but they occur with enough frequency they often prove to be a false alarm.

Sector Review- Materials Continue to Struggle
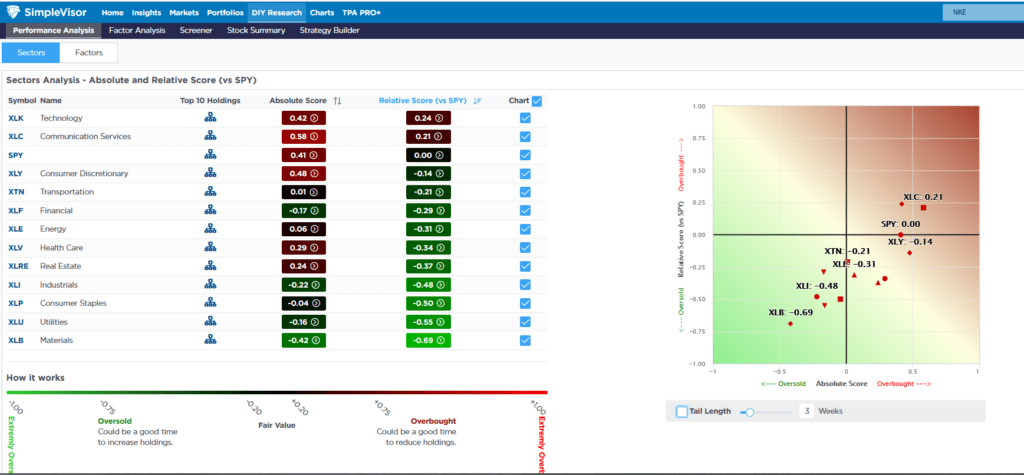
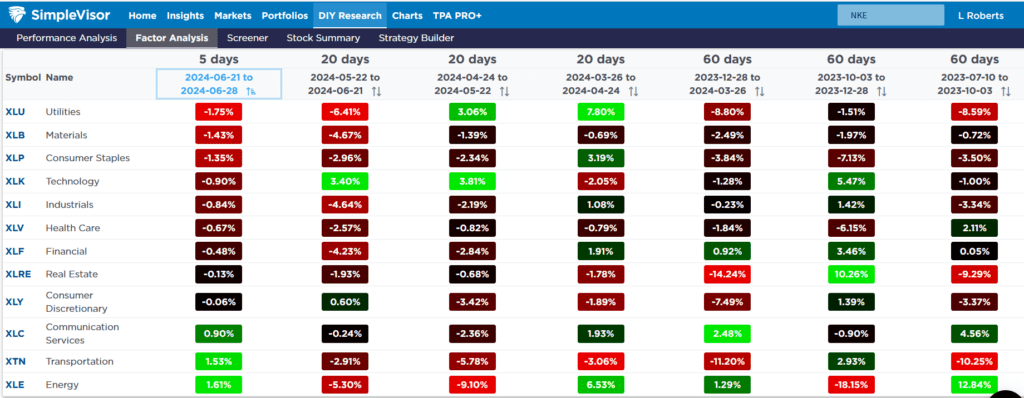
Over the last four weeks, the materials sector (XLB) has slipped by nearly 5% versus the S&P 500. Other than utilities, which are 6.5% worse than the S&P 500, it is the worst-performing sector over that period. Energy, which had the lowest relative SimpleVisor score for a few weeks running, was the market’s best-performing sector last week.
The second table, courtesy of SimpleVisor, shows the performance of each sector over consecutive periods ranging from the last five days to 20 and 60-day increments.
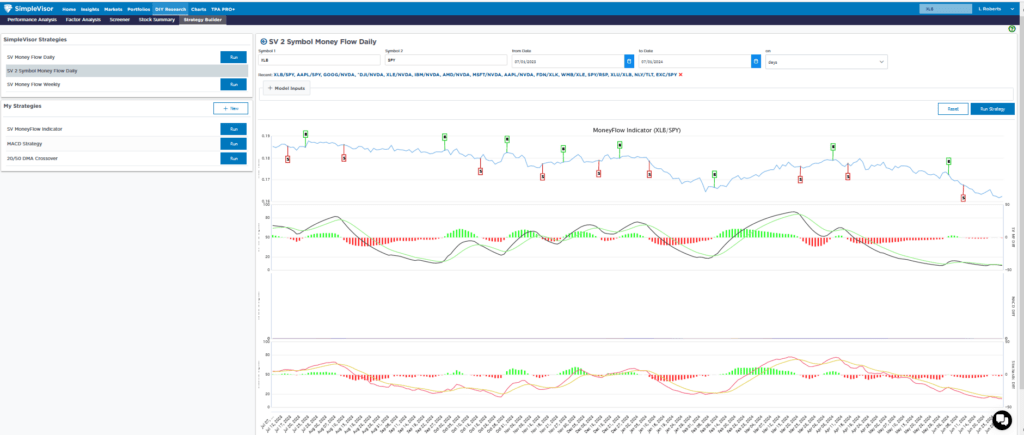
The third graph shows the price ratio of XLB to SPY. Other than XLB’s outperformance in the first quarter of 2024, XLB has been weak on a relative basis.
Some may say that the weakness in materials stocks is a telling signal about the state of the economy. We would counter, claiming that the service sector accounts for three-quarters of economic activity. The manufacturing sector has been in a recession for about two years, yet economic growth has been above average.



Tweet of the Day

“Want to achieve better long-term success in managing your portfolio? Here are our 15-trading rules for managing market risks.”
Please subscribe to the daily commentary to receive these updates every morning before the opening bell.
If you found this blog useful, please send it to someone else, share it on social media, or contact us to set up a meeting.
Post Views: 15
2024/07/02


