
- XDC Network nears a double-bottom breakout with its seventh consecutive bullish day, eyeing double-digit gains.
- AB token signals a local bottom formation as it prepares a rounding bottom reversal.
- Bonk breaks a crucial resistance amid a six-day uptrend, while the technical outlook suggests a retest.
The momentum among the top altcoins in the cryptocurrency market is declining as Bitcoin (BTC) slips below $108,000, following the announcement by US President Donald Trump of an extension in tariff deadlines to August 1. Altcoins such as XDC Network (XDC), AB (AB), and Bonk (BONK) hold momentum and gains from Monday, outpacing the broader market over the last 24 hours.
XDC Network nears a double-bottom breakout
XDC edges higher by nearly 2% on Tuesday, printing its seventh consecutive bullish day. The uptrend nears the 200-day Exponential Moving Average (EMA), close to the $0.067 resistance level, last tested on June 11.
Price action indicates a double bottom formation, with the $0.067 level serving as the neckline and the baseline at $0.057, excluding the price movements on June 22 and 23, outliers due to volatility spikes.
A potential close above $0.067 could extend the uptrend by 14% to $0.077, calculated by extrapolating the distance between the baseline and neckline from the potential breakout point.
The Moving Average Convergence/Divergence (MACD) indicator displays the rising MACD and signal lines crossing the zero line. An uptrend in the green histogram bars suggests rising momentum.
The Relative Strength Index (RSI) 68 approaches the overbought zone, indicating increased buying pressure.
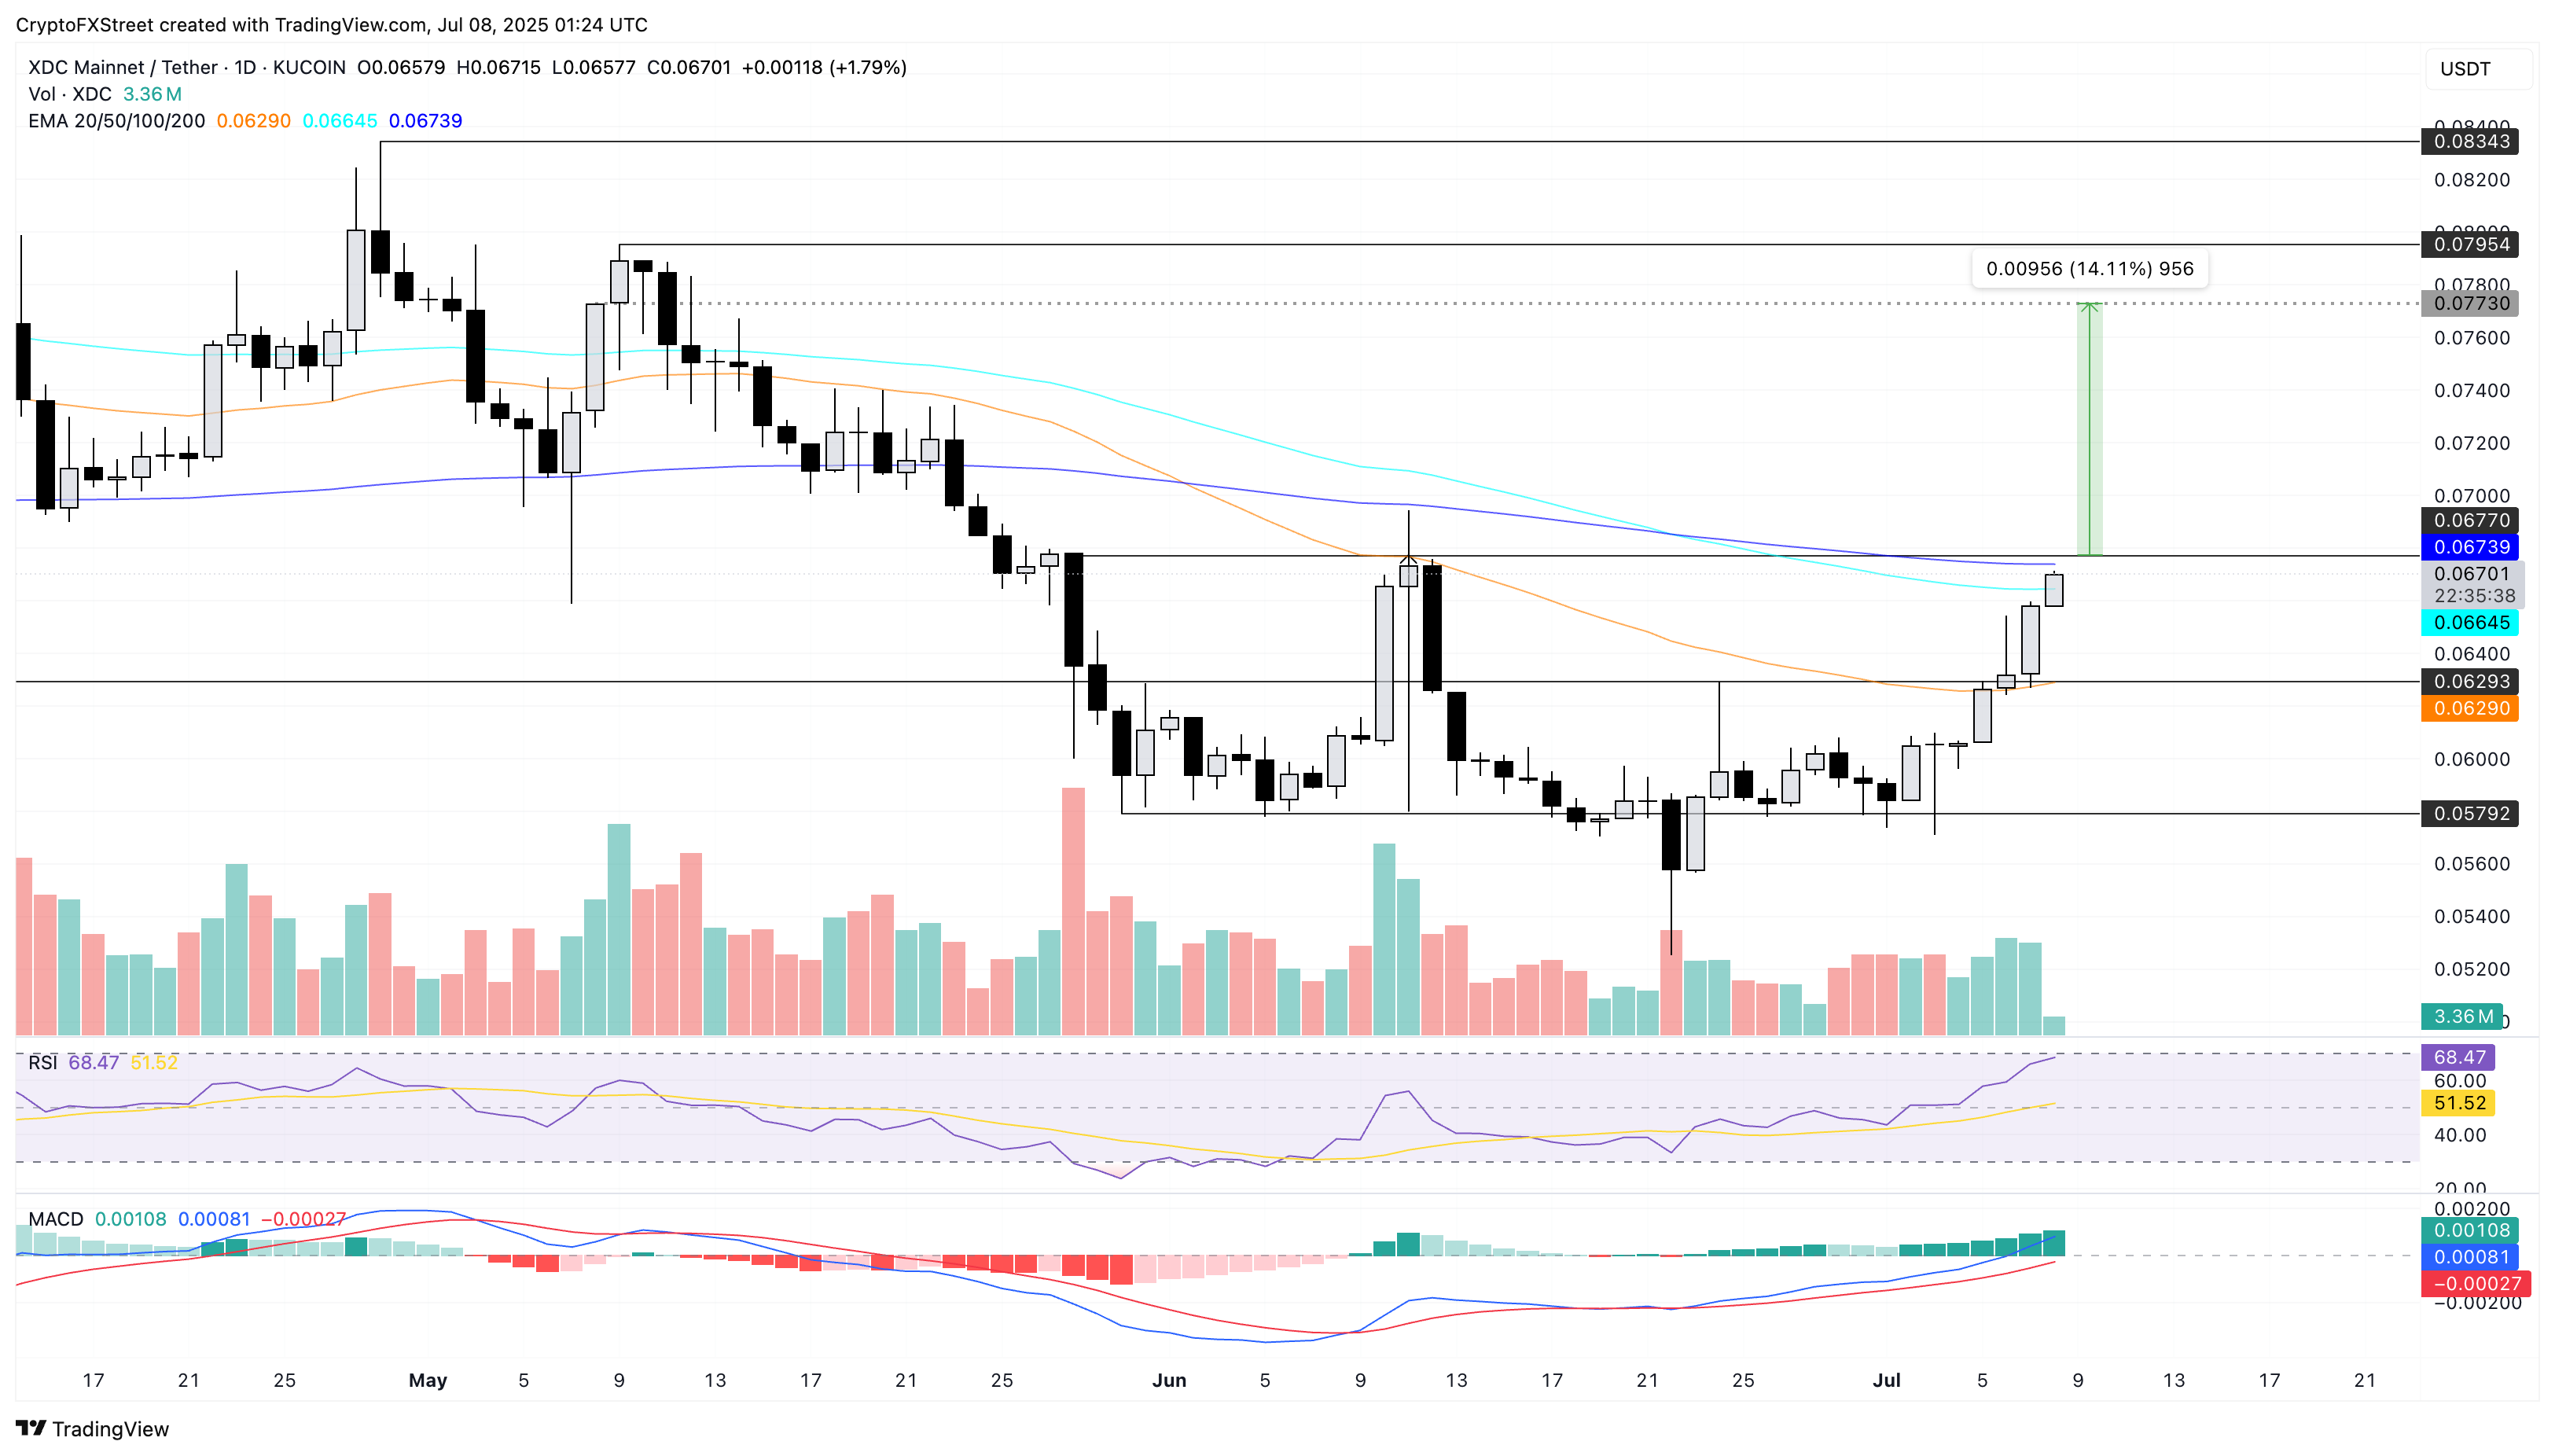
XDC/USDT daily price chart.
A failure to surpass the 200-day EMA could result in a pullback to the 50-day EMA at $0.062.
Trend reversal hope sparks in AB
AB marks its fourth consecutive day of recovery, bouncing off the local support level of $0.0079. At the time of writing, AB edges higher by 1% on Tuesday, nearing the 200-day EMA at $0.0084.
A push above the dynamic resistance could target the previous week’s high at $0.0089. If AB manages a daily close above this level, sidelined investors could consider this a breakout entry opportunity with the June 25 high of $0.010 as a potential target.
The MACD indicator displays the MACD and signal lines inching closer for a crossover, commonly considered a buy signal.
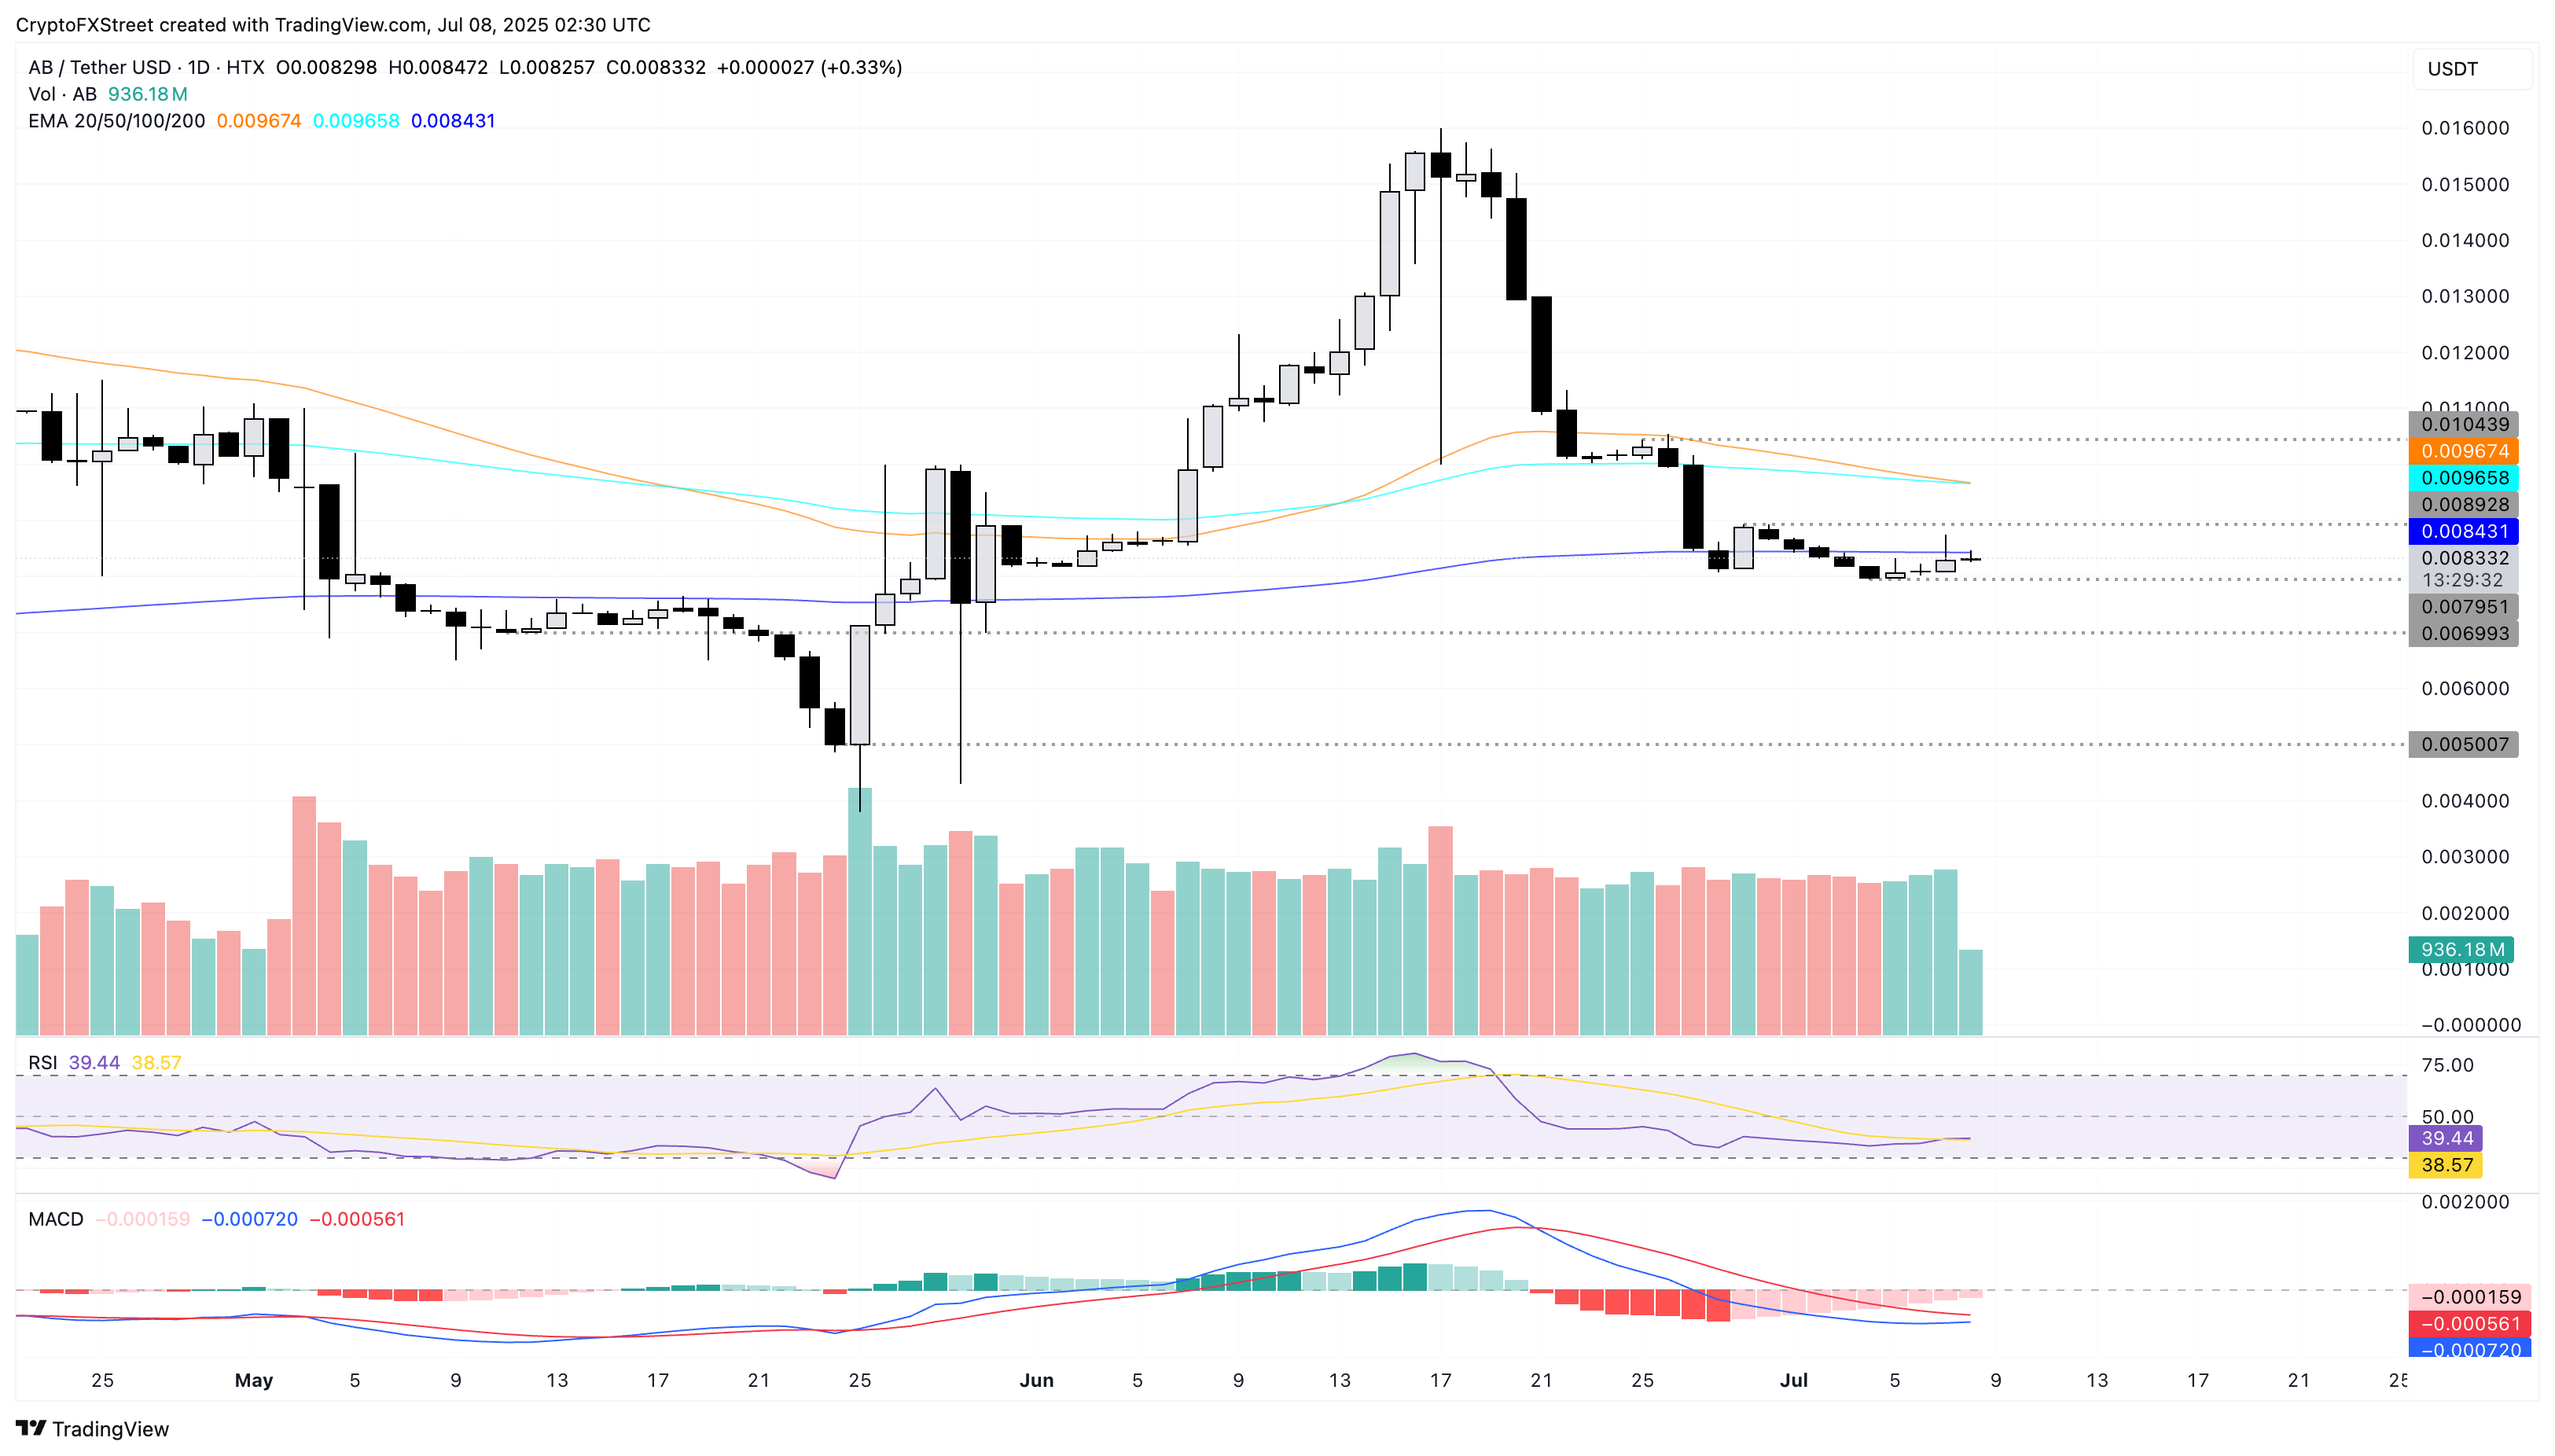
AB/USDT daily price chart.
A failure to hold support above $0.0079 could extend the declining trend in the altcoin towards $0.0069, last tested on May 30.
BONK breakout rally struggles to extend the uptrend
BONK ticks lower by over 1% at press time on Tuesday for the first time in seven days. The prevailing uptrend breaks above the 78.6% Fibonacci retracement level at $0.00002218, drawn from the April 7 low of $0.00000886 to the high of May 12 at $0.00002581.
As the intraday pullback retests the broken Fibonacci level, the possibility of a post-retest reversal stays on the table. If the meme coin holds above the crucial support level, it could potentially test the May 12 high of $0.00002581.
The 50-day and 100-day EMAs are inching closer to a bullish crossover, indicating a short-term buying opportunity.
Similar to the XDC Network, the MACD indicator suggests increasing momentum in BONK. Still, the RSI lowering in the overbought zone to 72 signals a potential pullback.
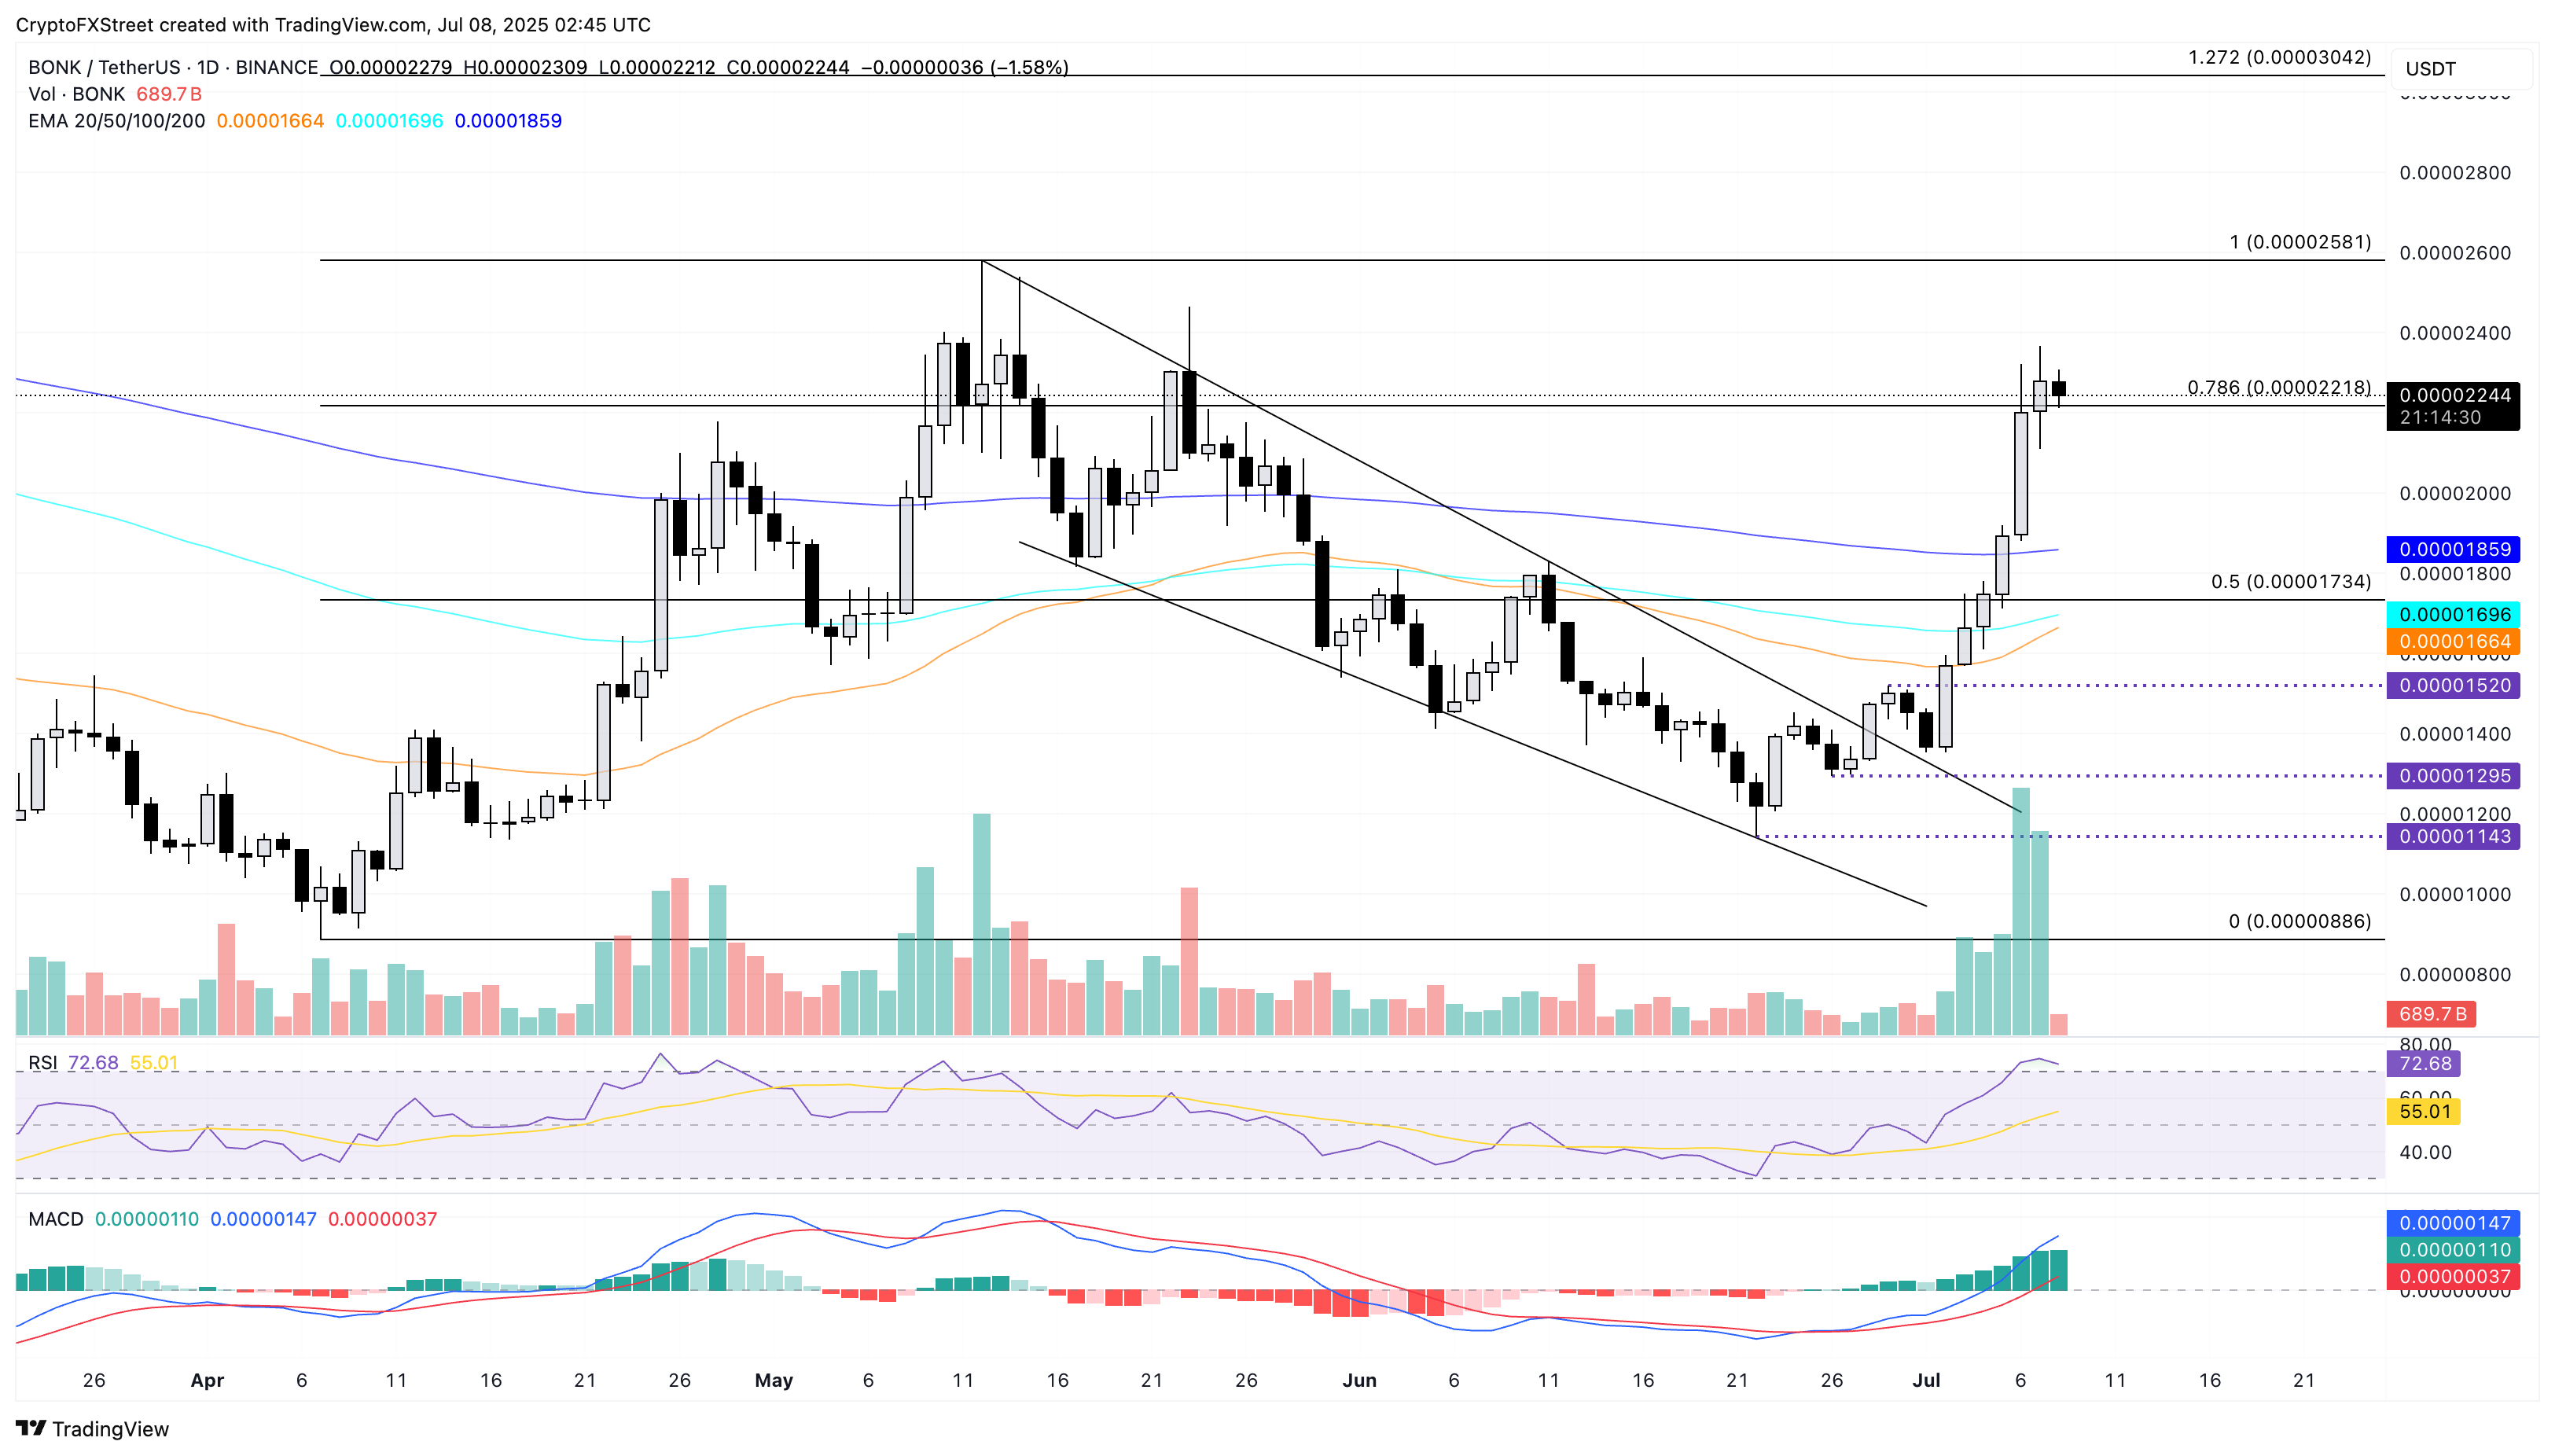
BONK/USDT daily price chart.
If BONK marks a daily close below $0.00002218, the meme coin could extend its decline to the 200-day EMA at $0.00001859.