
- Chainlink leads the market recovery with a 13% surge on Sunday.
- Arbitrum edges lower after a nearly 9% rise amid an impending Golden Cross.
- MemeCore extends gains with a wedge breakout.
Chainlink (LINK) emerges as the frontrunner in the cryptocurrency market over the last 24 hours following the 13% jump on Sunday. Altcoins such as Arbitrum (ARB) and MemeCore (M) follow the bullish trend, gaining traction after a recovery run on Sunday. The technical outlook remains mixed, as altcoins struggle to extend their gains at press time on Monday.
Chainlink gains traction as LINK reserves grow
Chainlink’s recovery run gains momentum underpinned by its LINK reserve announcement, which fuels demand and limits supply with buybacks. The LINK reserve holds 109,663 tokens as of Monday.
LINK reverses from its $26.50 high as it trades at $25.66 at press time on Monday, risking the gains made on Sunday. If LINK holds the uptrend, a decisive close above the $26.68 resistance would mark the highest close so far in 2025. Sidelined investors could consider this a buy opportunity, potentially targeting the $30 milestone.
The Moving Average Convergence Divergence (MACD) and its signal line continue to maintain an uptrend, indicating increasing bullish momentum. Still, the Relative Strength Index (RSI) is at 71, moving flat near the overbought boundary, indicating reversal risk as buying pressure nears saturation.
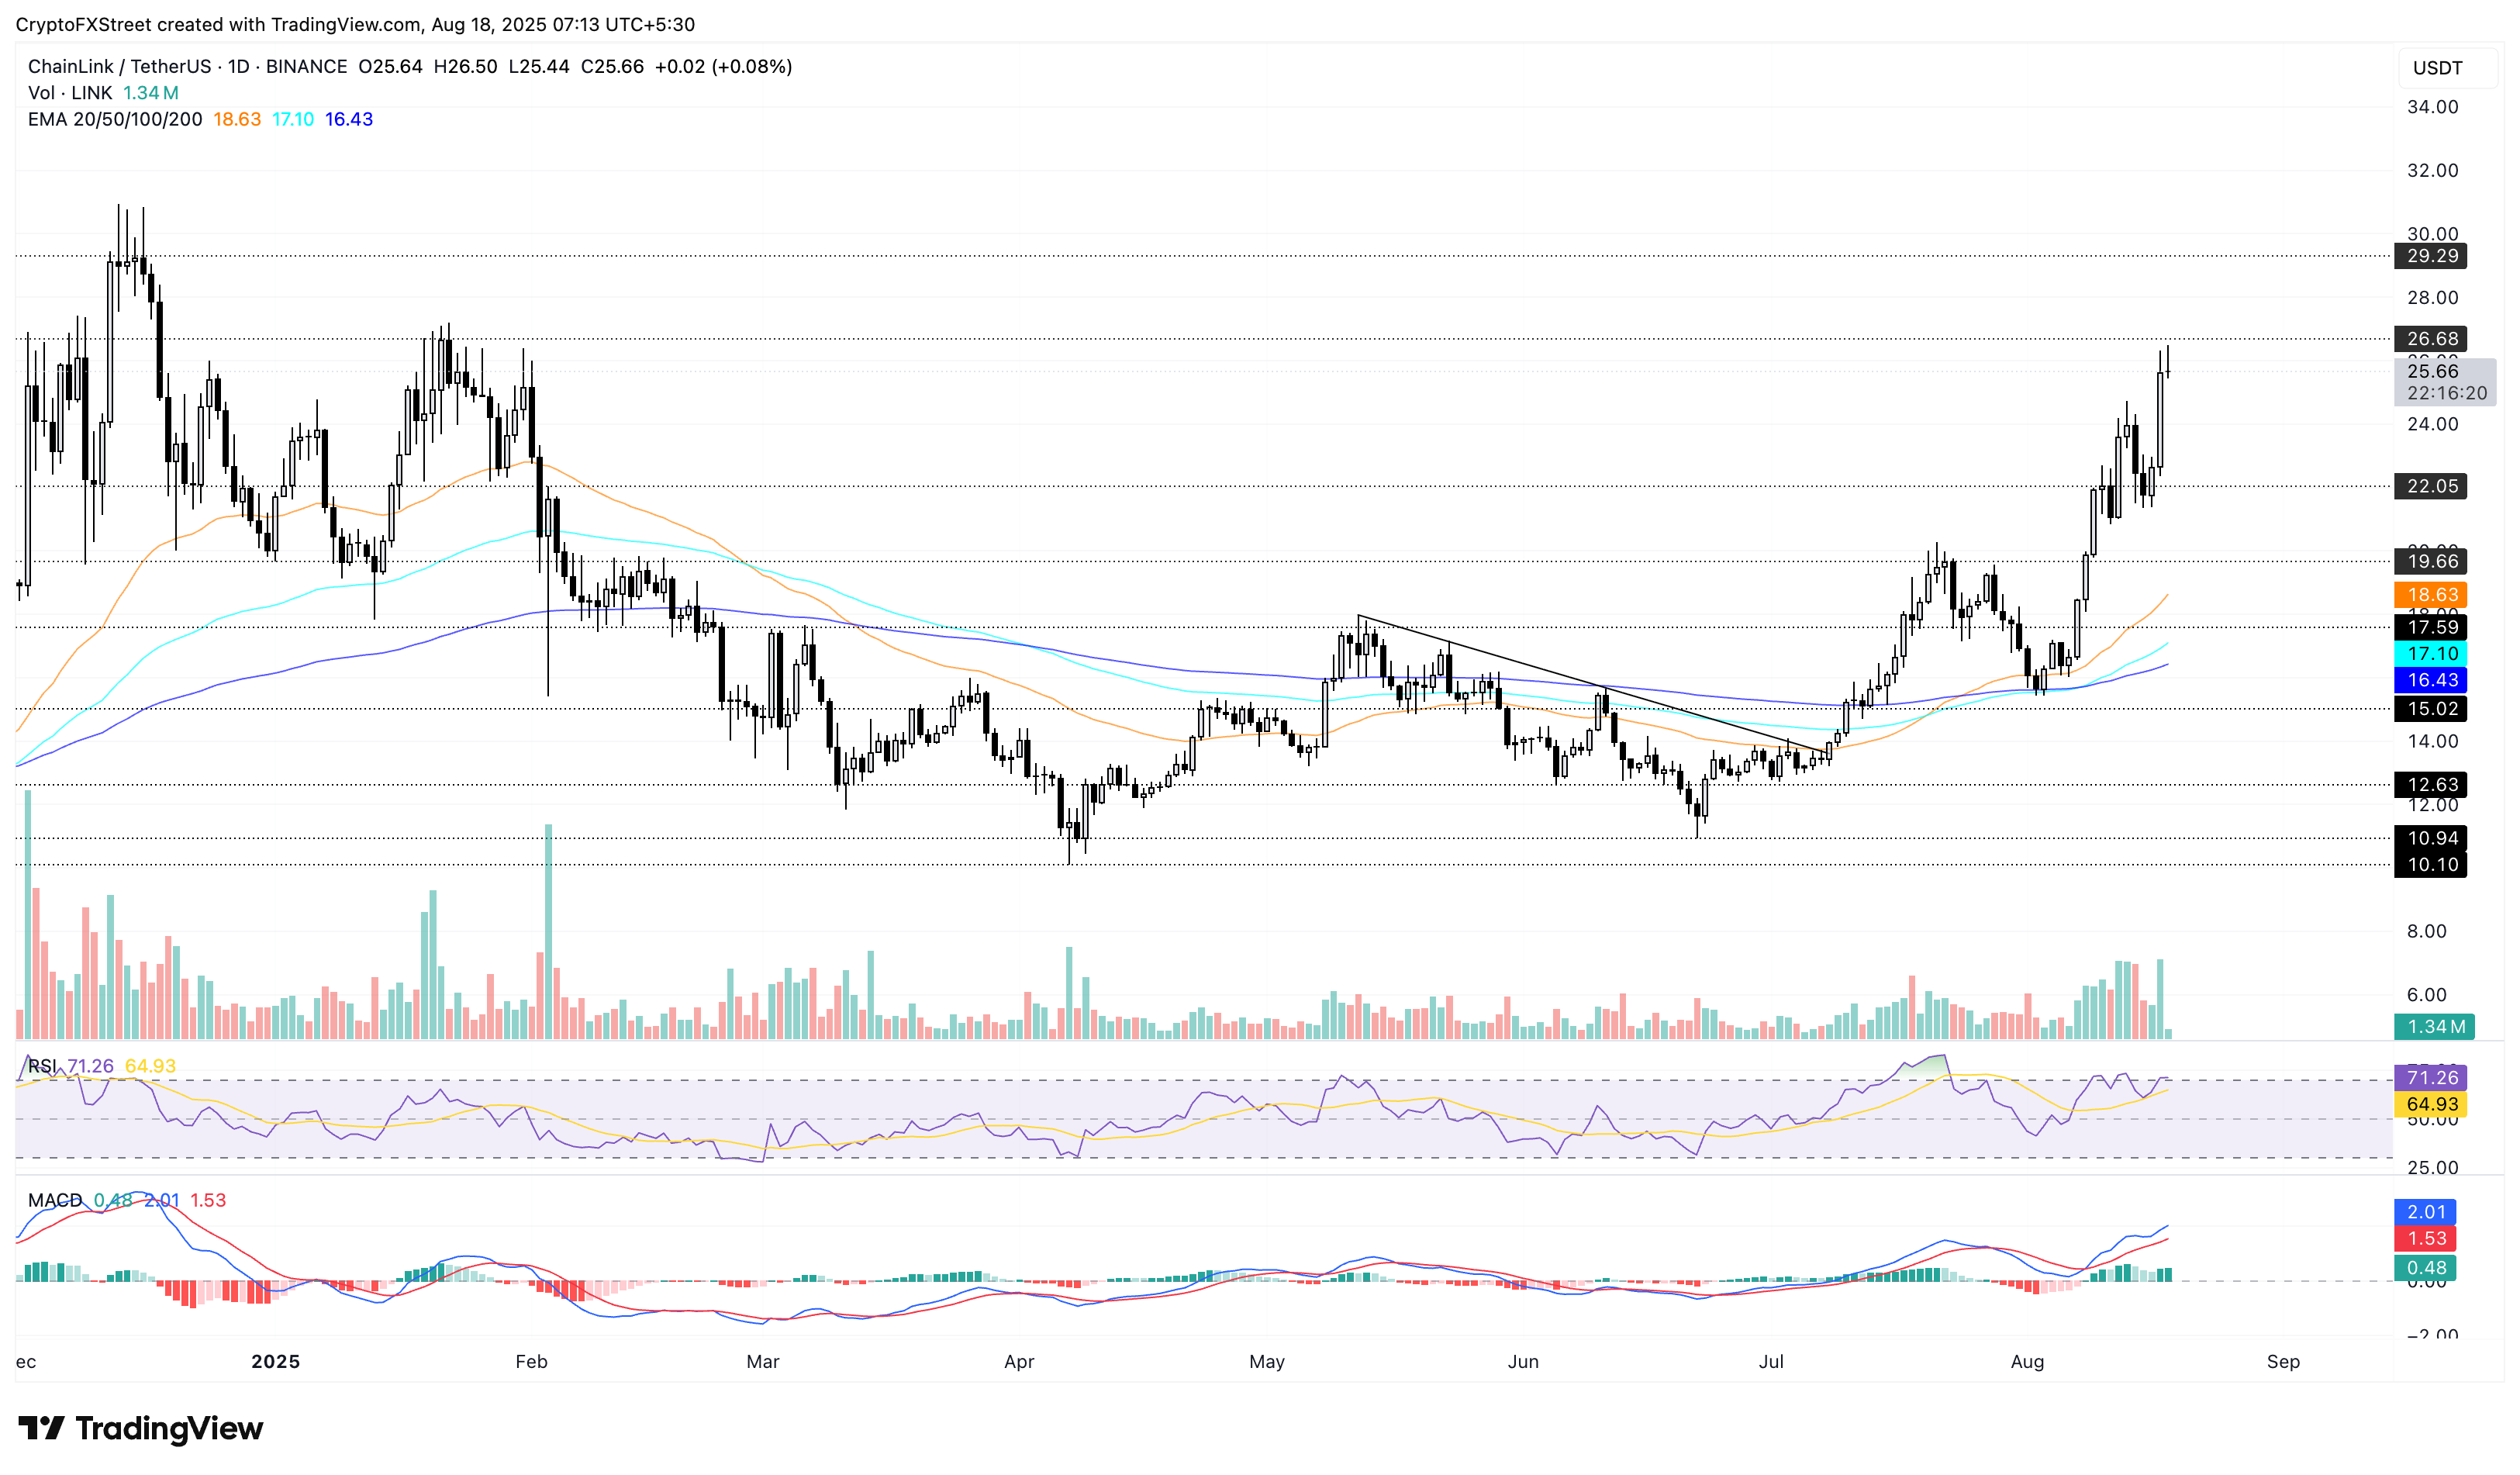
LINK/USDT daily price chart.
In the event of a bearish reversal, LINK could retest the $22.05 support, last tested on Saturday.
Arbitrum risks consolidation
Arbitrum edges lower by over 1% at the time of writing on Monday, after an 8.87% rise on Sunday. The reversal reflects the overhead pressure present near the $0.5712 resistance marked by Wednesday’s close.
ARB continues to consolidate with the lower band at $0.4842, last tested on Saturday. A decisive close below this could challenge the 200-day Exponential Moving Average (EMA) at $0.4437.
Notably, the rising 50-day is inching closer to the 200-day EMA for a Golden Cross. Sidelined investors could consider this a buy signal as the short-term trend gains traction.
The RSI reads 60 on the daily chart, pointing downwards, indicating a loss in buying pressure. Still, the MACD indicator suggests holding a bullish momentum.
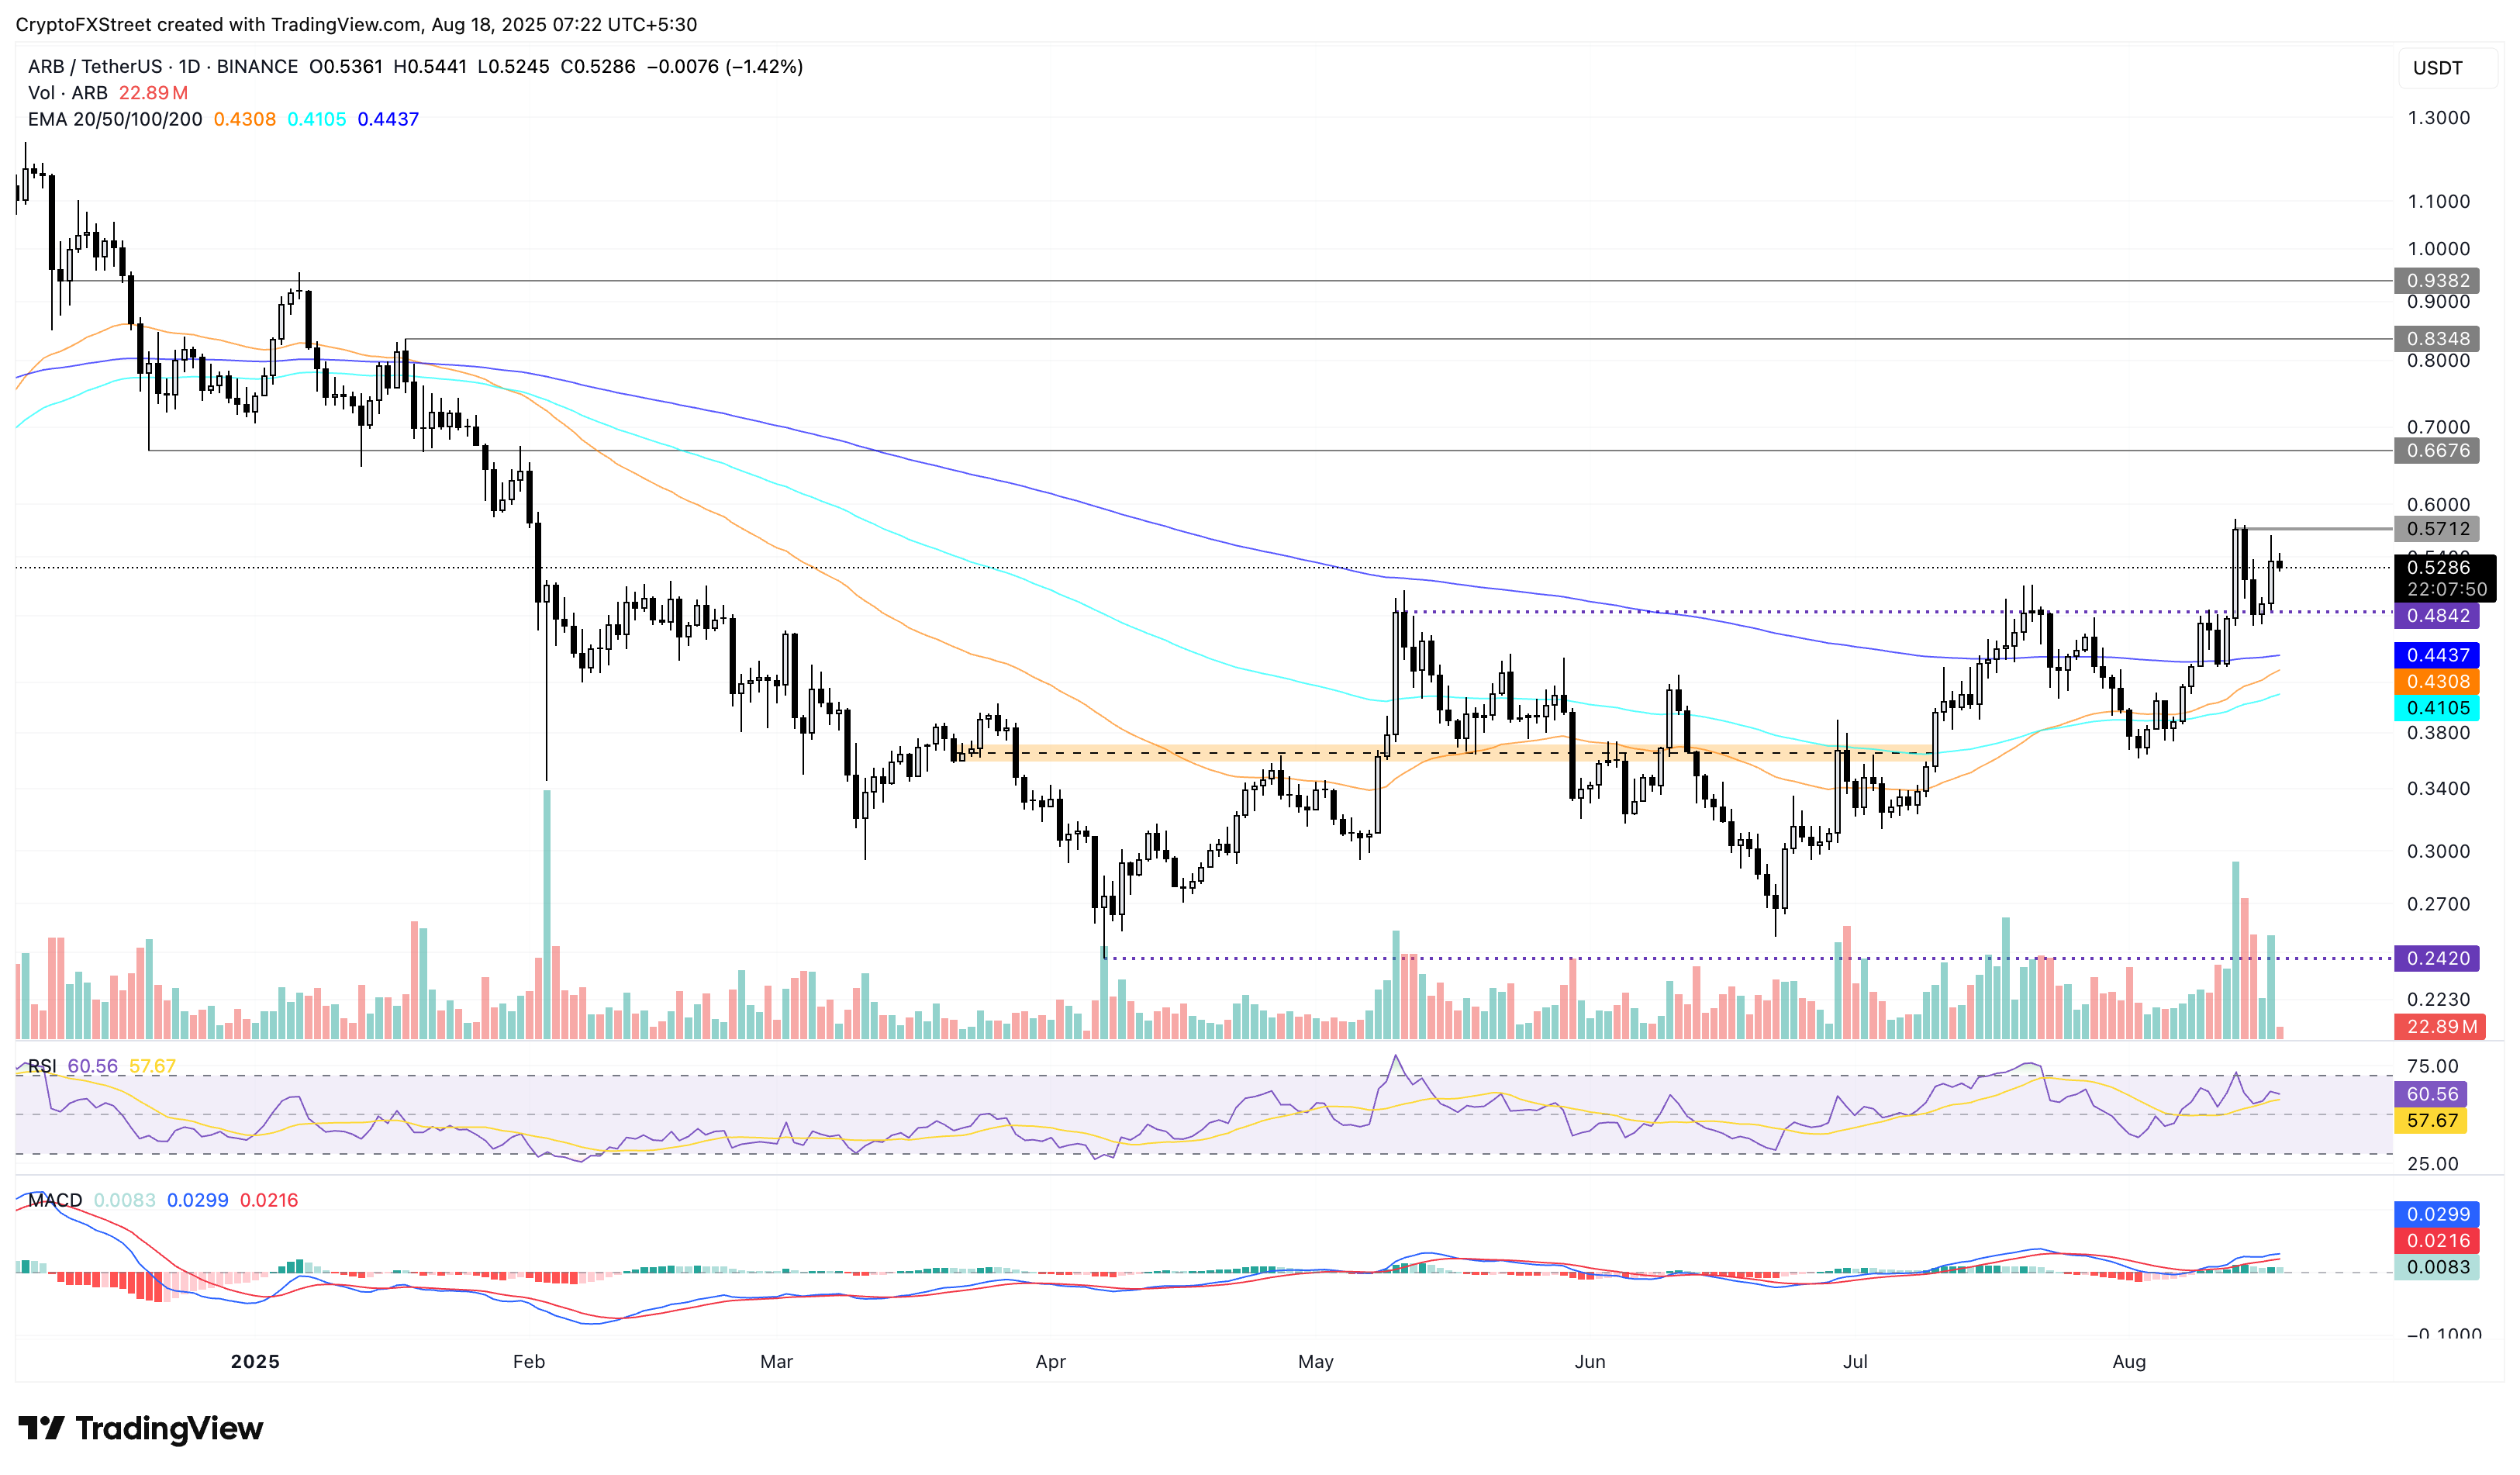
ARB/USDT daily price chart.
Looking up, a close above $0.5712 could extend the uptrend to $0.6676, last tested on January 31.
MemeCore’s breakout run retests a dynamic support
MemeCore breaks out of a falling wedge pattern on the 4-hour chart (shared below). The meme coin retests the 50-period EMA $0.4351, holding above crucial dynamic support.
MemeCore’s breakout rally targets the $0.4846, if the 4-hour candle sustains above the 50-day EMA.
The momentum indicators maintain a bullish bias, as the RSI reads 54, having crossed above its signal line. The MACD and its signal line inch closer to the zero line, suggesting rising bullish momentum.
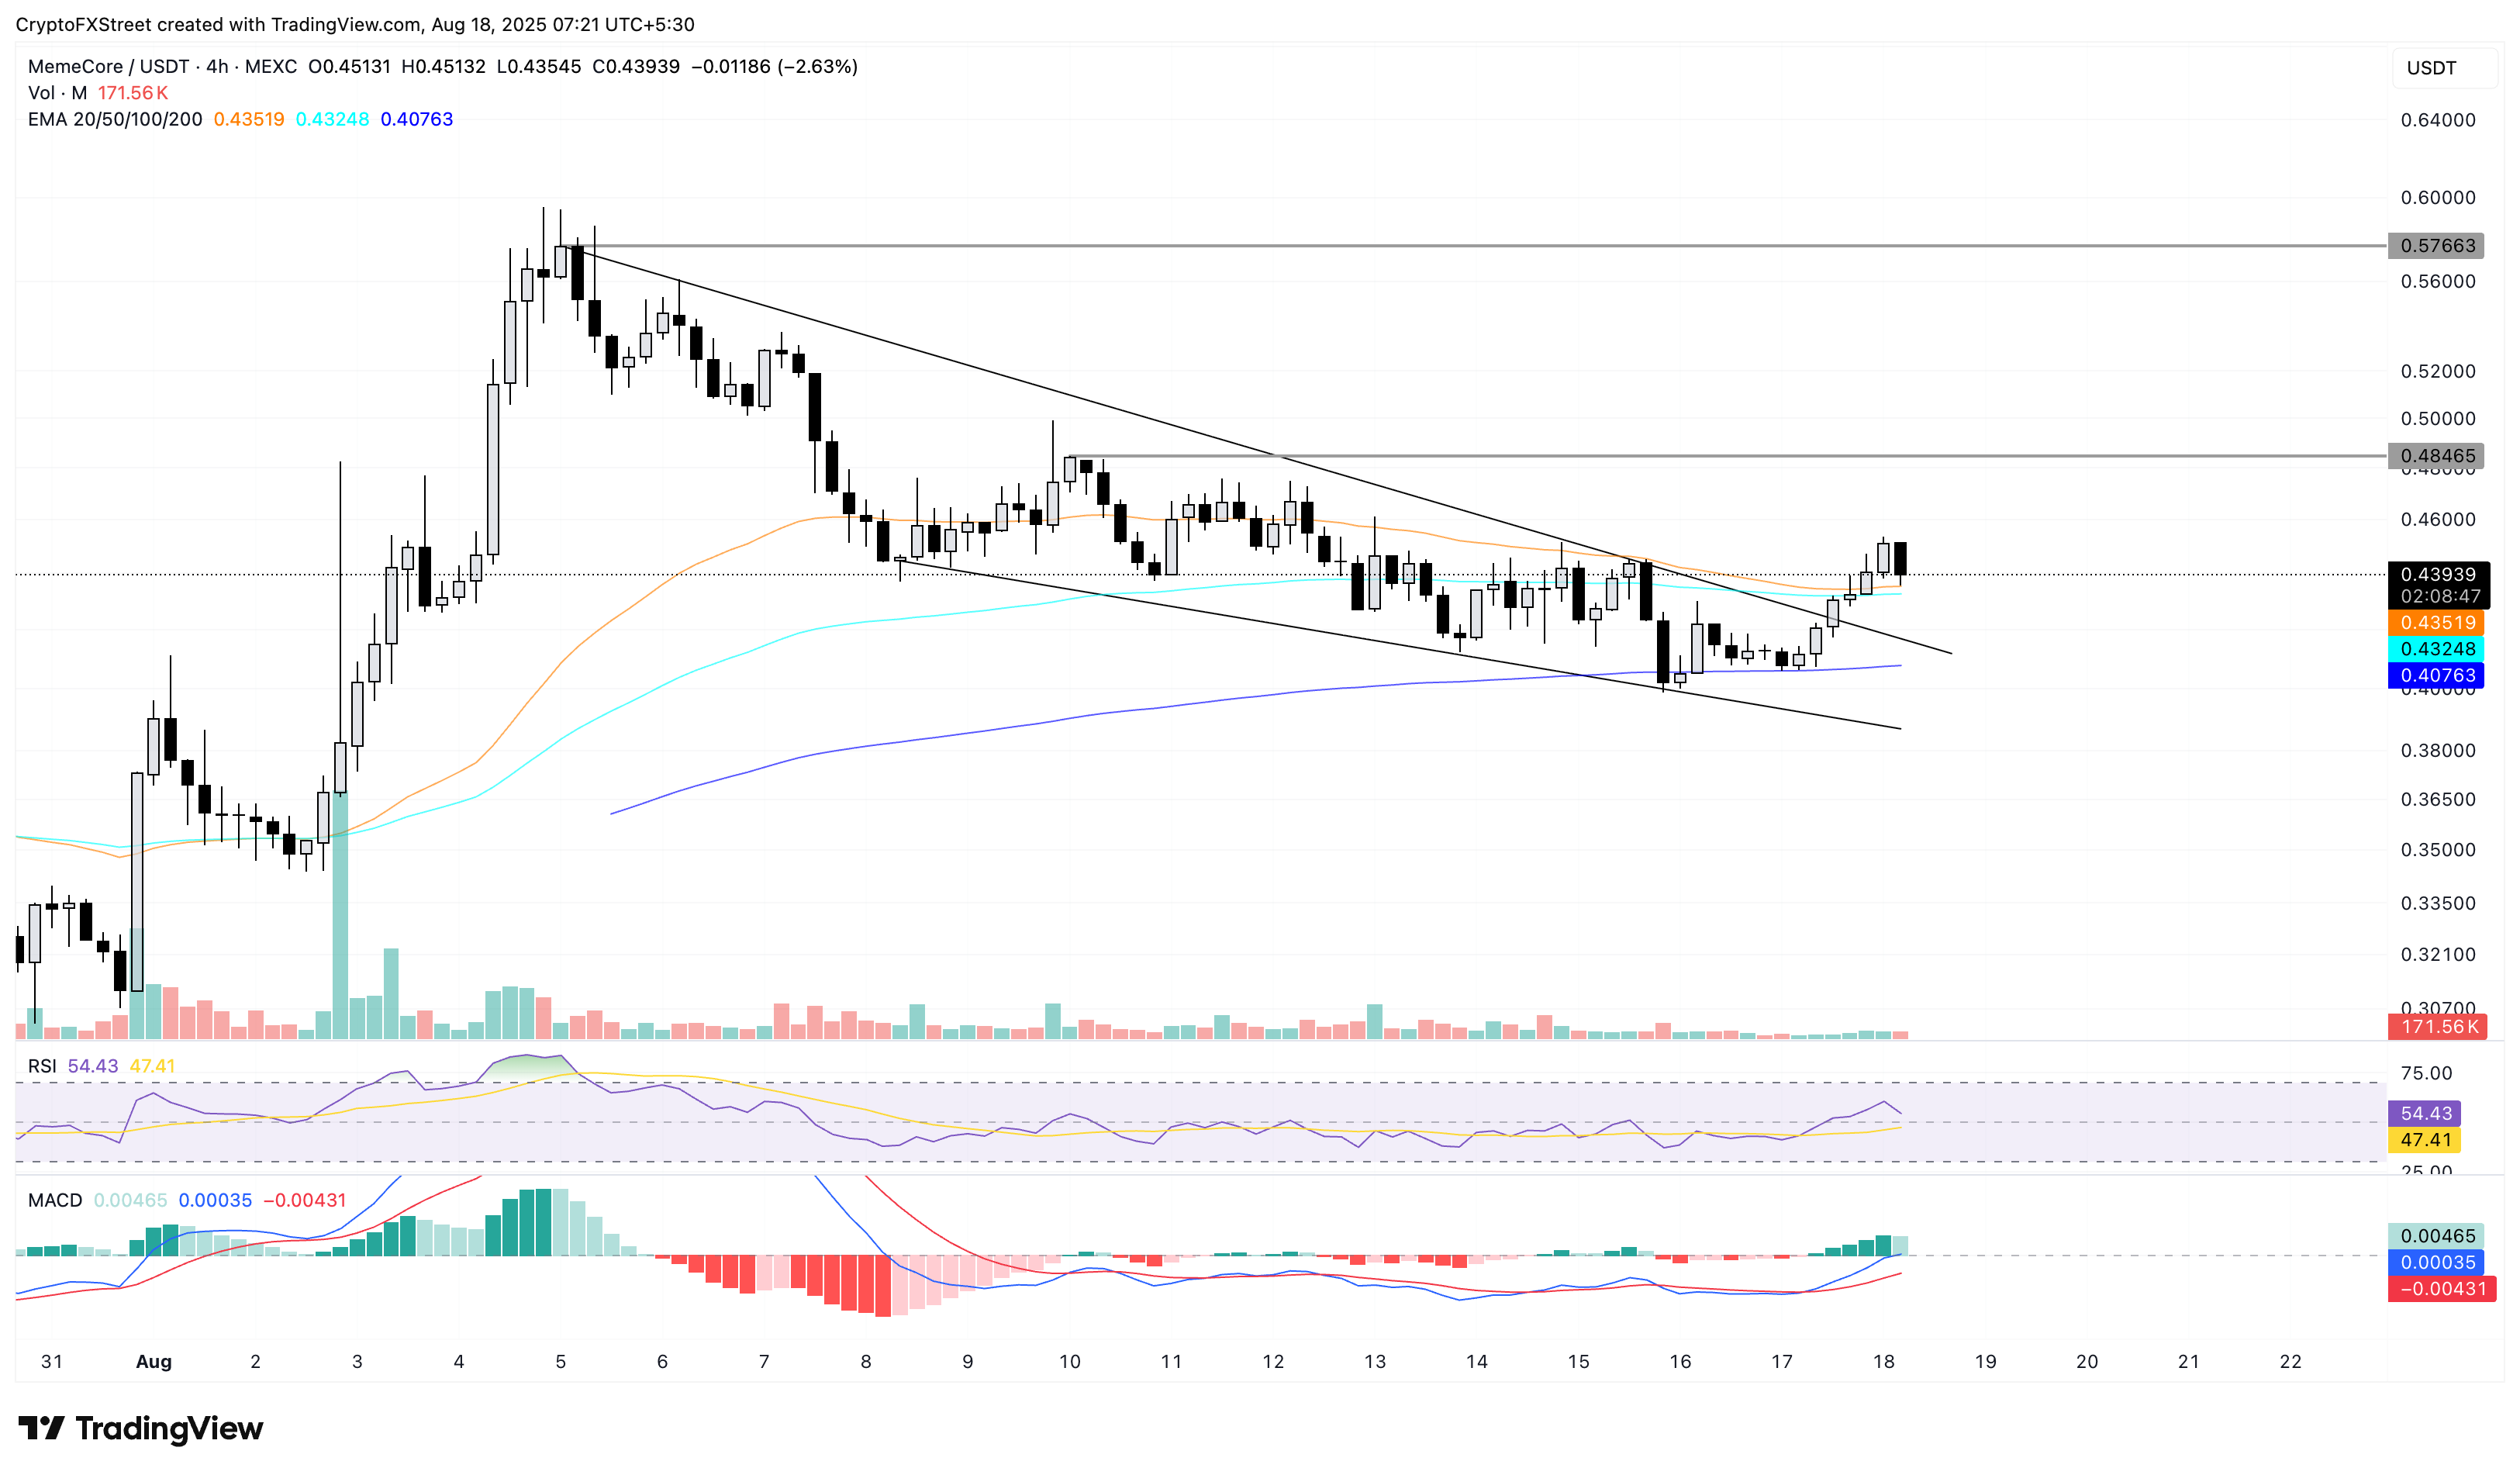
M/USDT daily price chart.
Looking down, a decisive close below the 50-period EMA could extend the decline to the broken resistance trendline near the $0.4000 level.