
- Bitcoin pulls back under $105,000 as the cryptocurrency market generally consolidates.
- Bullish sentiment takes a step back amid fading retail demand in the past weeks.
- Ethereum’s consolidation around the $2,600 support level signals potential for gains beyond $3,000 as spot ETF inflows remain steady.
Minor losses characterize the cryptocurrency market as prices broadly consolidate following last week’s sell-off. Bitcoin (BTC) hovers below $105,000 and above $104,000 at the time of writing on Thursday after the recovery staged earlier this week failed to gain steam, falling short of resistance at $107,000.
Ethereum’s outlook, on the other hand, remains relatively bullish, holding firmly to support around $2,600 while signaling a potential breakout that could target $3,000.
Market overview: Dwindling retail and institutional demand subdues Bitcoin’s recovery
The mundane technical structure reflects fading retail and institutional demand, which has seen Bitcoin spot Exchange Traded Funds (ETFs) inflows dwindle, even turning negative for three consecutive days last week.
Sentiment across the market slipped amid heightened tensions due to tariff uncertainty in the United States (US) following a court’s decision to block the implementation of the duties, which cited President Donald Trump’s disregard for the Constitution.
The appeals court granted the Justice Department’s request, allowing the tariffs to remain in effect pending further resolution.
Consolidation in the broader crypto market could continue into the weekend due to current indecision and low interest from traders. For instance, Bitcoin’s derivatives market has shown a minor drop in Open Interest (OI) to $70.70 million. Long position liquidations totaled $36 million over the past 24 hours, compared to roughly $7 million in short positions.
OI refers to the total number of outstanding futures or options contracts that have yet to be settled or closed, indicating market activity and liquidity. Declining OI means low market participation and interest among traders.
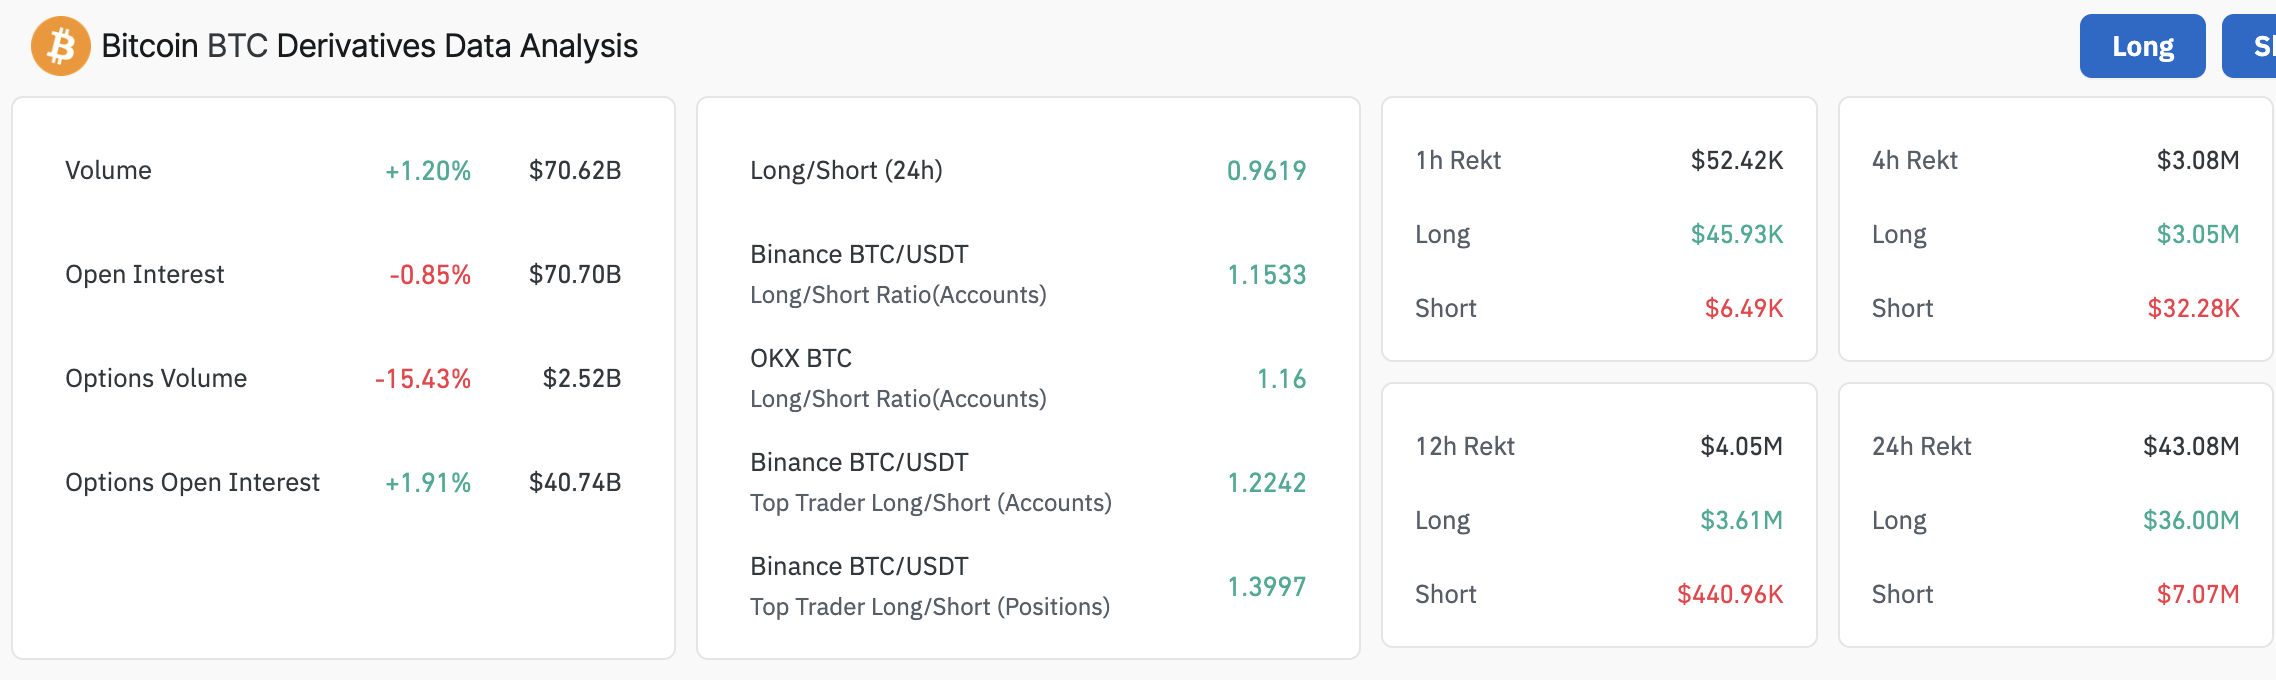
Bitcoin Open Interest | Source: CoinGlass
Data spotlight: Retail demand fades as Bitcoin’s uptrend snaps
Bitcoin’s drop from all-time highs of around $111,980 was primarily driven by declining ETF-related selling. According to SoSoValue, spot ETFs recorded $87 million in net inflows on Wednesday after the $378 million on Tuesday, following three consecutive days of outflows.
“The recent outflows may be partly driven by monthly portfolio rebalancing, especially as BTC has outperformed the S&P 500 and Nasdaq for three straight months, reaching new all-time highs,” a K33 Research market update released on Tuesday outlined. “Mandated allocation adjustments, combined with seasonal patterns of weaker summer performance in crypto markets, likely contributed to selling pressure,” the report added.
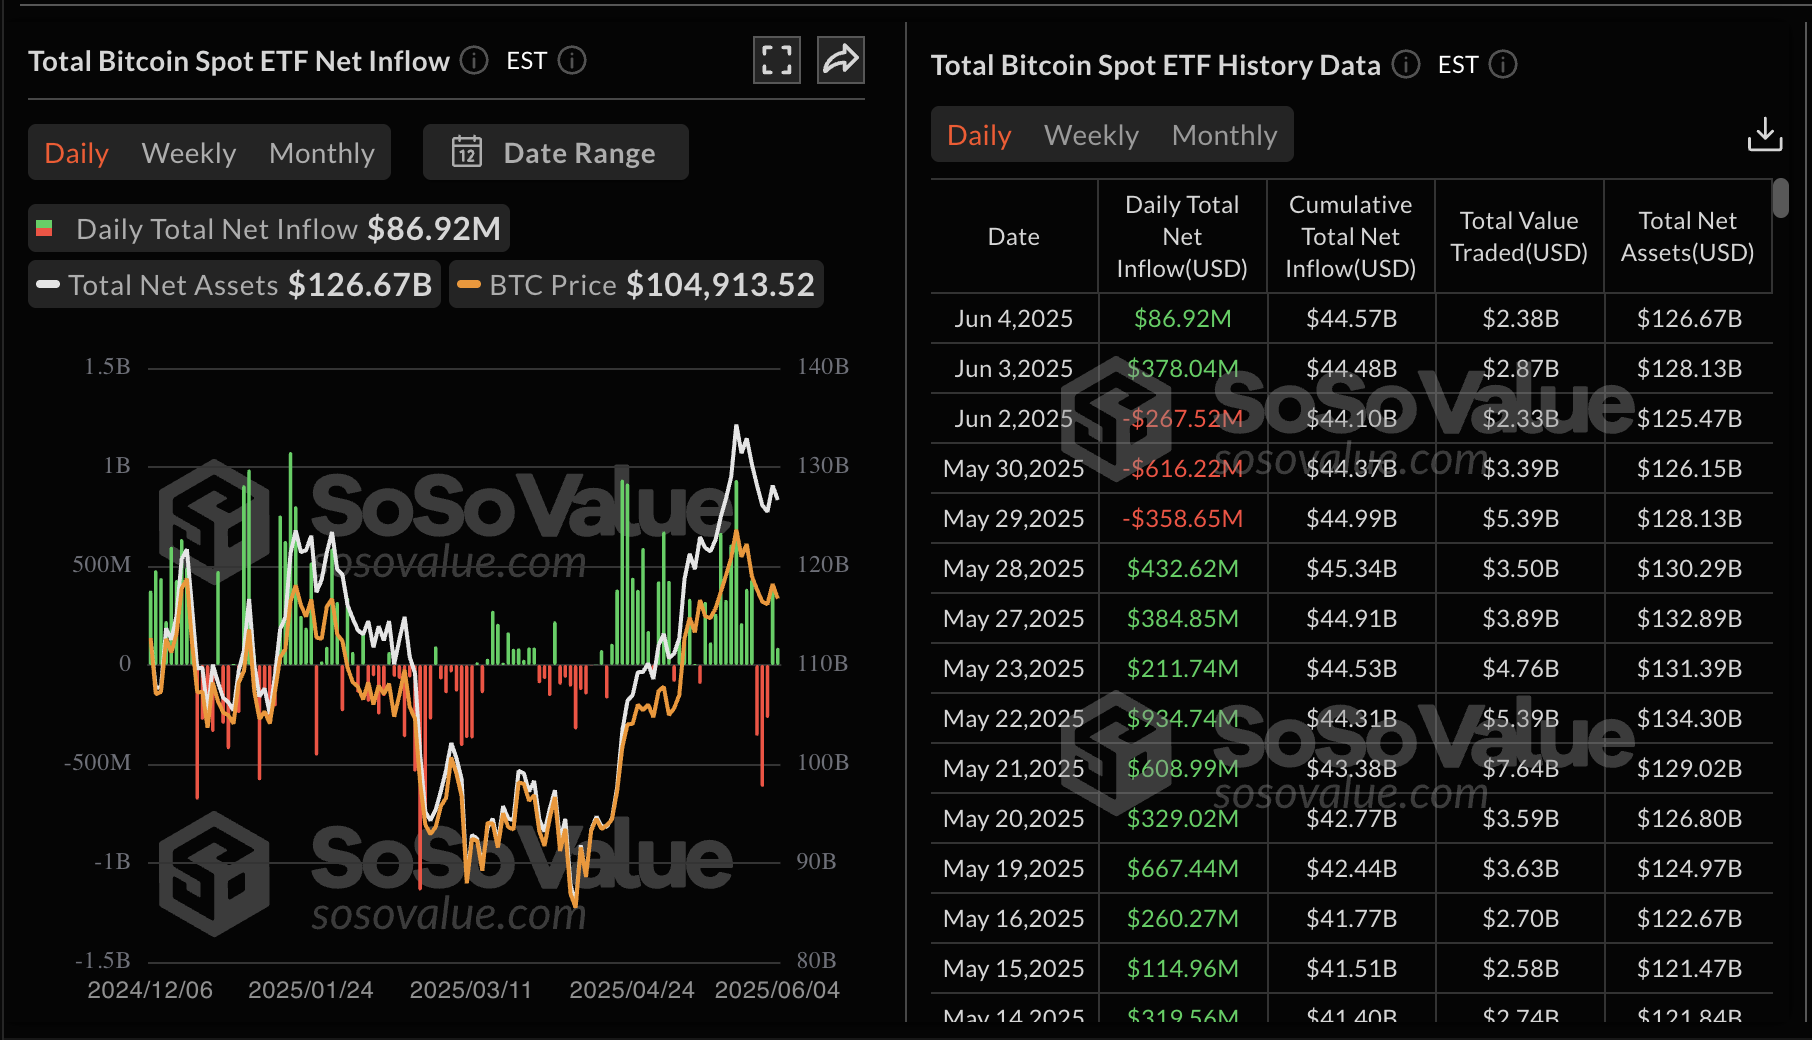
Bitcoin spot ETF inflows | Source: SoSovalue
Retail demand has reduced amid the drop in institutional interest. CryptoQuant data indicate that the retail transfer volume, which ranges between zero and $10,000, has decreased from $423 million to $408 million since Bitcoin reached its new all-time high on May 22.
The drop suggests that retail investors are highly sensitive to price changes, particularly corrections. However, for BTC to have a healthy bull run, retail demand and volume are expected to be consistent.
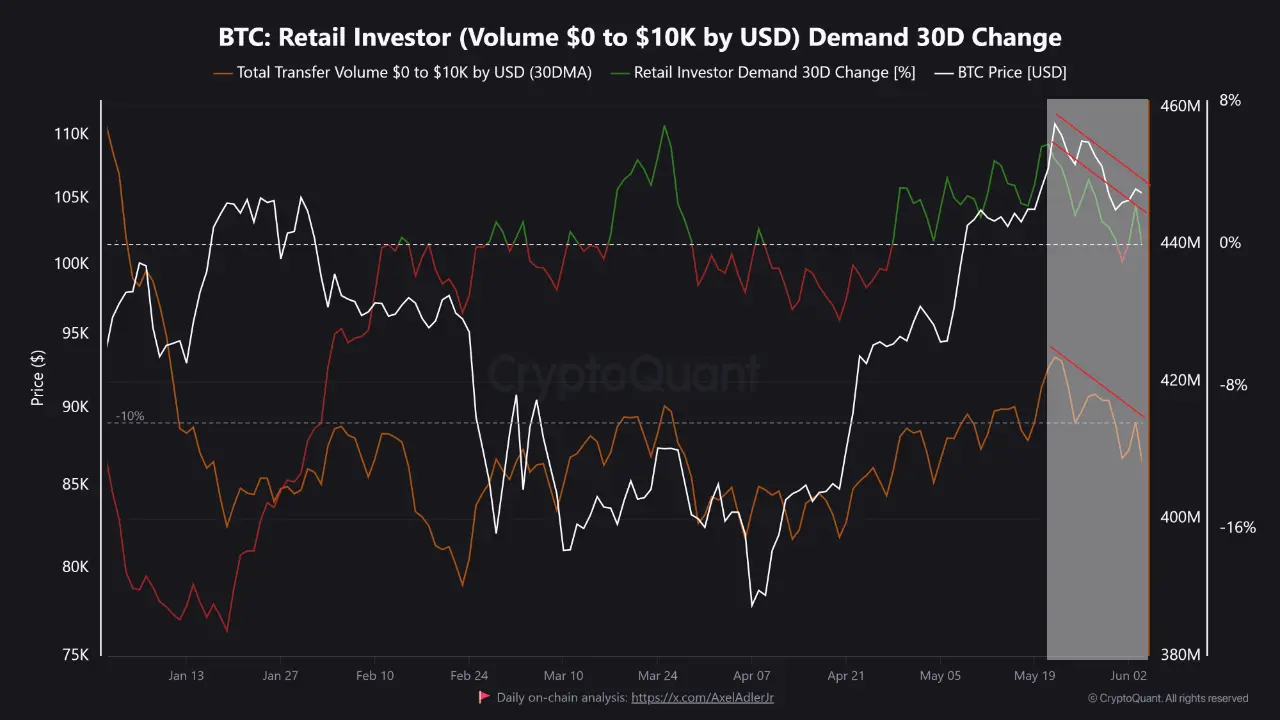
Bitcoin retail investor transfer volume | Source: CryptoQuant
Meanwhile, institutional demand for Ethereum has remained steady despite the lethargic sentiment in the crypto market. ETH spot ETFs saw approximately $57 million in net inflow volume on Wednesday. This marked 13 consecutive days of inflows.
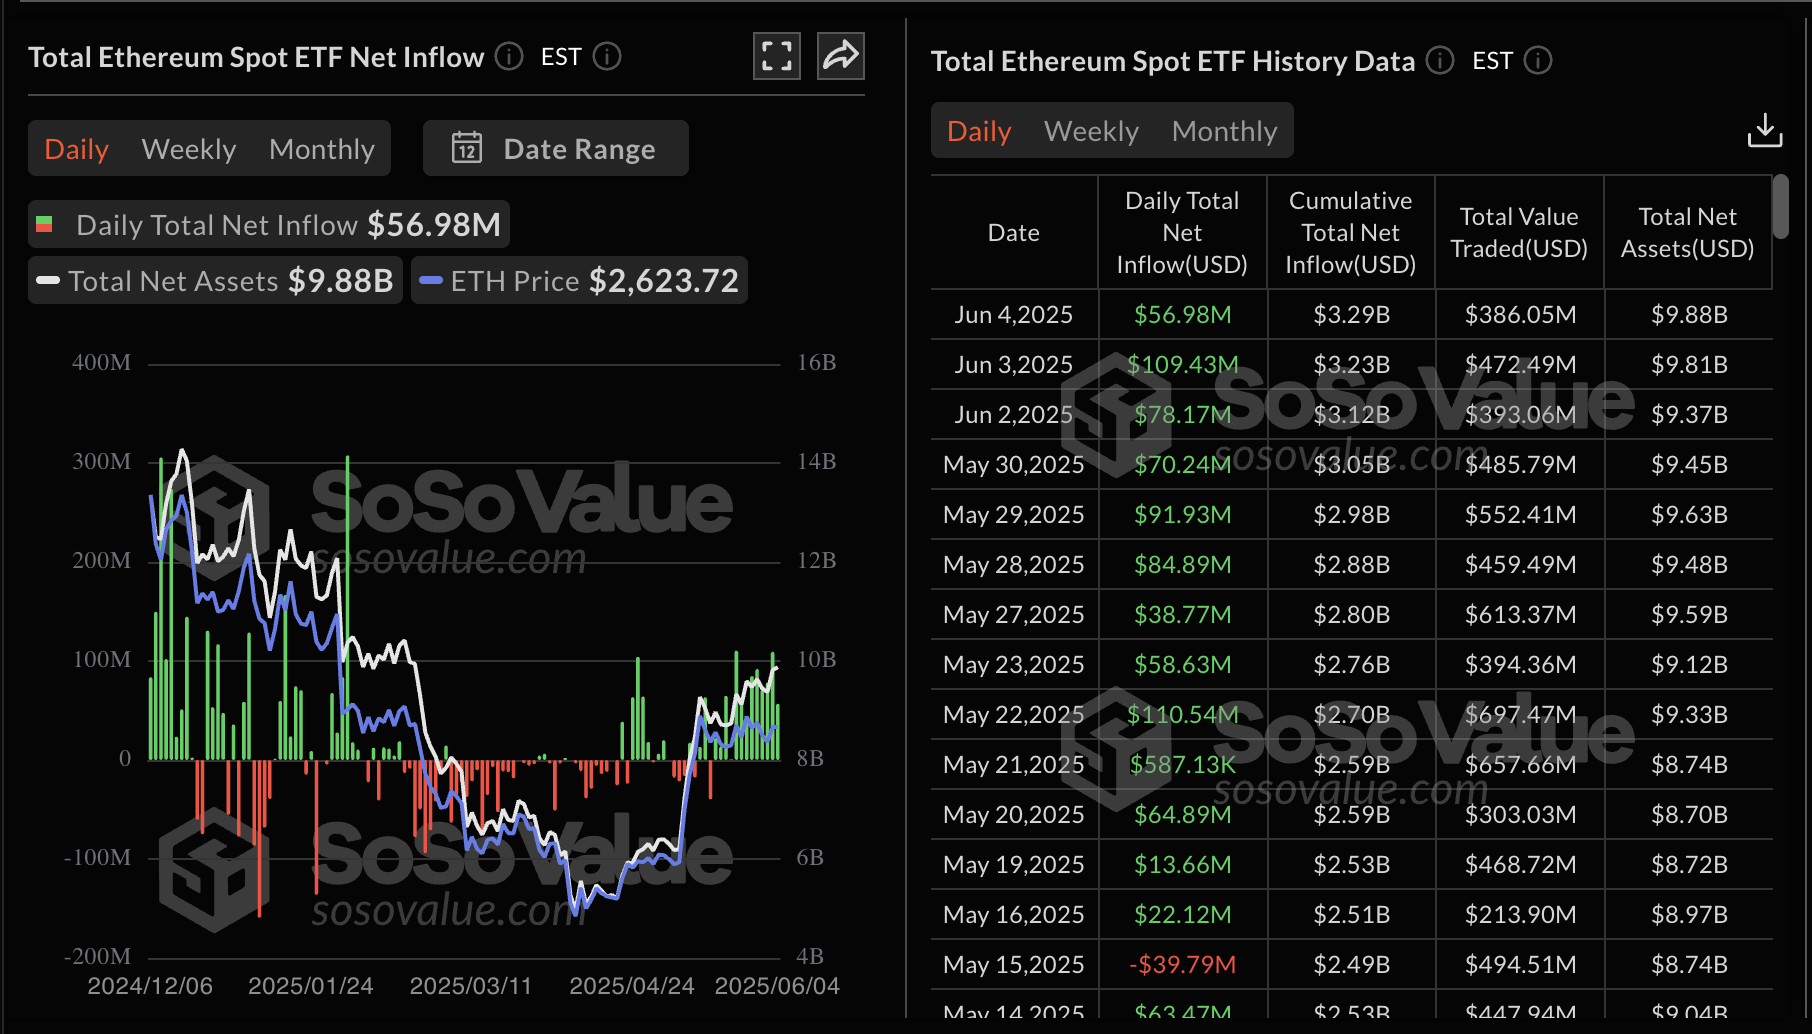
Ethereum spot ETF stats | Source: SoSoValue
Chart of the day: What’s next as Bitcoin’s technical outlook offers bearish signals
Bitcoin’s rally in May was primarily driven by institutional interest and uncertainty surrounding the sustainability of US debt. Twelve public companies launched Bitcoin treasury strategies during the month, positioning BTC as an alternative hedge to Gold.
Technically, Bitcoin is experiencing a heavy upside, exerting pressure on lower levels, hence the drop below $105,000 on Wednesday. The BTC price hovers around $104,834 on Thursday, reflecting little change since the market opened.
The path of least resistance appears downward as the Moving Average Convergence Divergence (MACD) indicator sustains a sell signal from May 26. This call for traders to sell BTC occurred when the blue MACD line crossed below the red signal.
Further correction could follow, bringing the region around $103,000, tested as support last week, into focus. The 50-day Exponential Moving Average (EMA) at around $100,955 is in line to absorb selling pressure if declines accelerate.
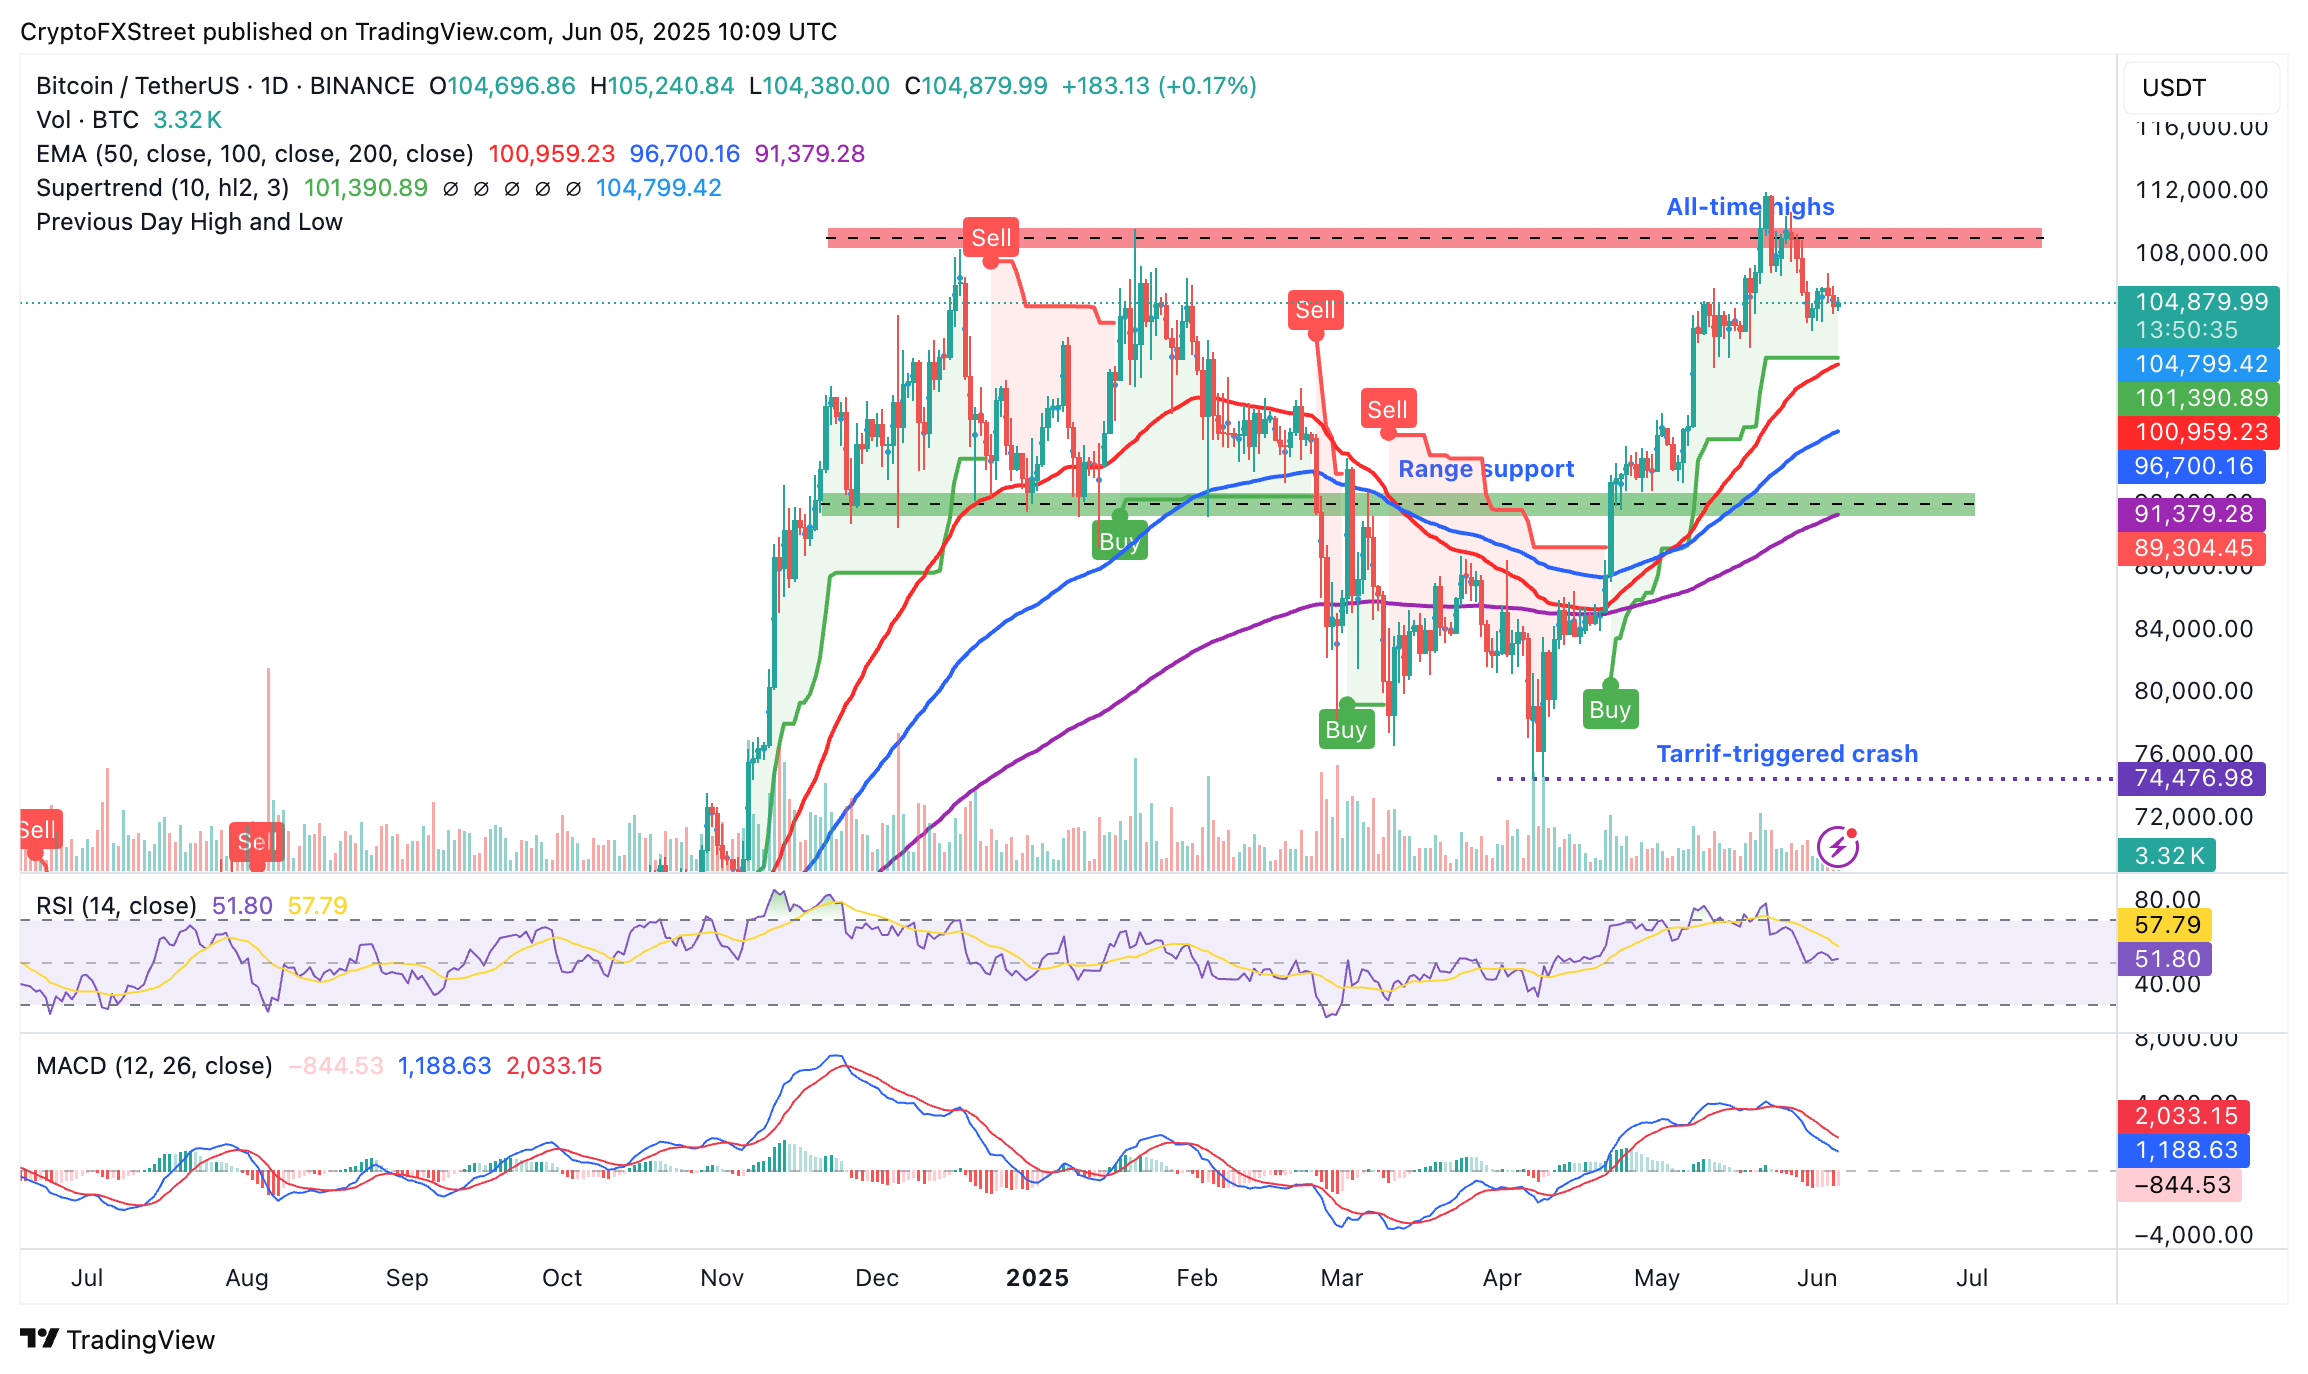
BTC/USD daily chart
Ethereum’s bullish structure remains steady, buoyed by growing ETF inflow volumes and positive sentiment following the implementation of the Pectra upgrade in May.
The largest smart contracts token by market capitalization exchanges hands slightly above $2,600 support at the time of writing, upholding consolidation in a slightly uptrending channel, as shown below.
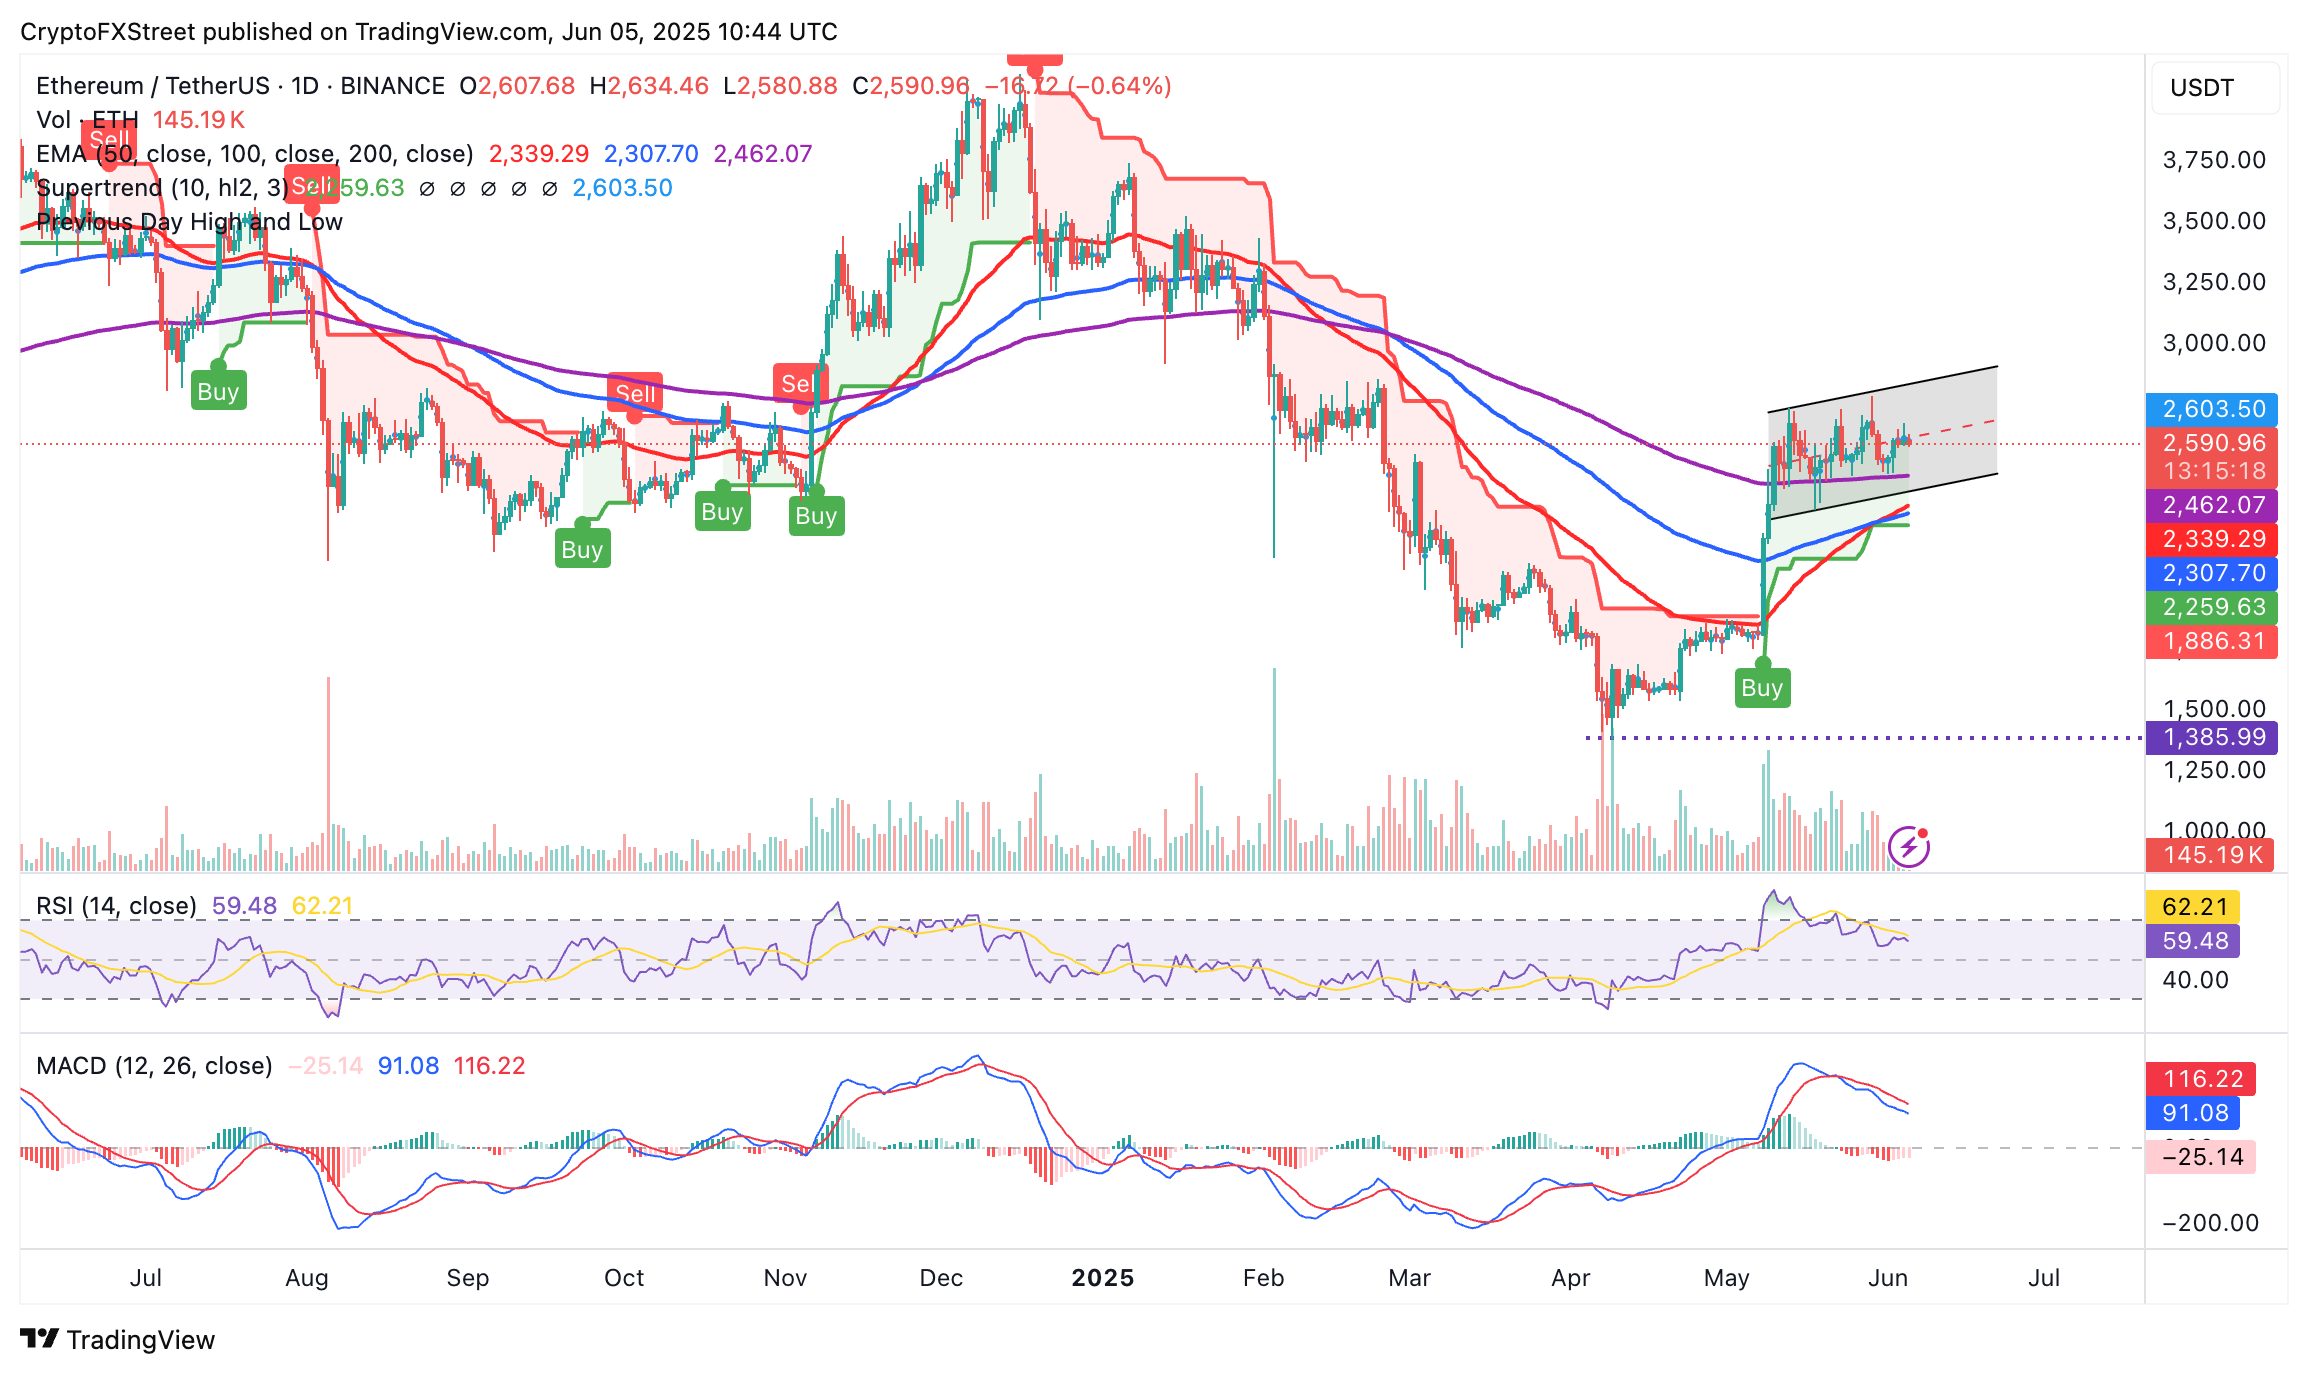
ETH/USDT daily chart
A buy signal from the SuperTrend indicator validates the bullish outlook, encouraging traders to increase exposure to ETH, thus creating demand. This tool, used as a dynamic support and resistance indicator, sends a buy signal when the ETH price moves above it, changing the color to green from red.
Still, a MACD sell signal calls for caution among traders as it slopes toward the zero line (0.00). Should traders start to aggressively sell Ethereum, the ongoing consolidation could pave the way for another pullback. Key areas of interest on the downside include the 200-day EMA at $2,462 and the 50-day EMA at $2,339.