
- Bitcoin loses $107,000 support as short-term technical indicators, including the RSI, turn bearish.
- Interest in Bitcoin has plummeted to its lowest level since October despite the BTC price holding above $106,000.
- Ethereum and XRP are broadly consolidating above key support levels, with the decline likely to extend into upcoming sessions.
Bitcoin (BTC) edges down for a second consecutive day, with the price dancing between the round-figure support at $100,000 and resistance slightly below all-time highs of $111,980. Interest in Bitcoin has continued to drop, signaling a lack of confidence particularly among retail investors.
The altcoin sector suffers from the same lack of interest, evidenced by the elusive altcoin season. For instance, Ethereum (ETH) saw its uptrend snap around $2,882 in June before extending the down leg to $2,111 amid geopolitical tensions and macroeconomic uncertainty.
Market overview: Bitcoin, Ethereum, XRP show weakness ahead of Fed Chairman Powell’s speech
Market sentiment remains subdued ahead of the United States (US) Federal Reserve (Fed) Chair Jerome Powell’s speech, alongside European Central Bank (ECB) President Christine Lagarde, at the 2025 ECB Forum on Central Banking on Tuesday.
The Fed left interest rates unchanged at the end of June’s meeting in the range of 4.25%-4.5%, calling for patience and the need to study incoming economic data before considering cuts.
Despite the hawkish stance of the central bank, which projected a resurgence of short-term inflation due to the impact of tariffs, policymakers still anticipate that there will be two interest rate cuts this year.
Bitcoin, Ethereum, and XRP briefly steadied their uptrend following June’s policy meeting, buoyed by a weakening US Dollar (USD). FXStreet reported that the US dollar Index plummeted to 97 on Tuesday, the lowest level since March 2022.
Data spotlight: Institutional flows persist as retail interest plunges
Interest in Bitcoin has fallen to 28, the lowest level since October, according to Google Trends. Interest in the search term “bitcoin” peaked at 100 in November, following US elections, but has maintained a general downtrend ever since — a peculiar situation, considering the price of BTC remains elevated above $100,000.
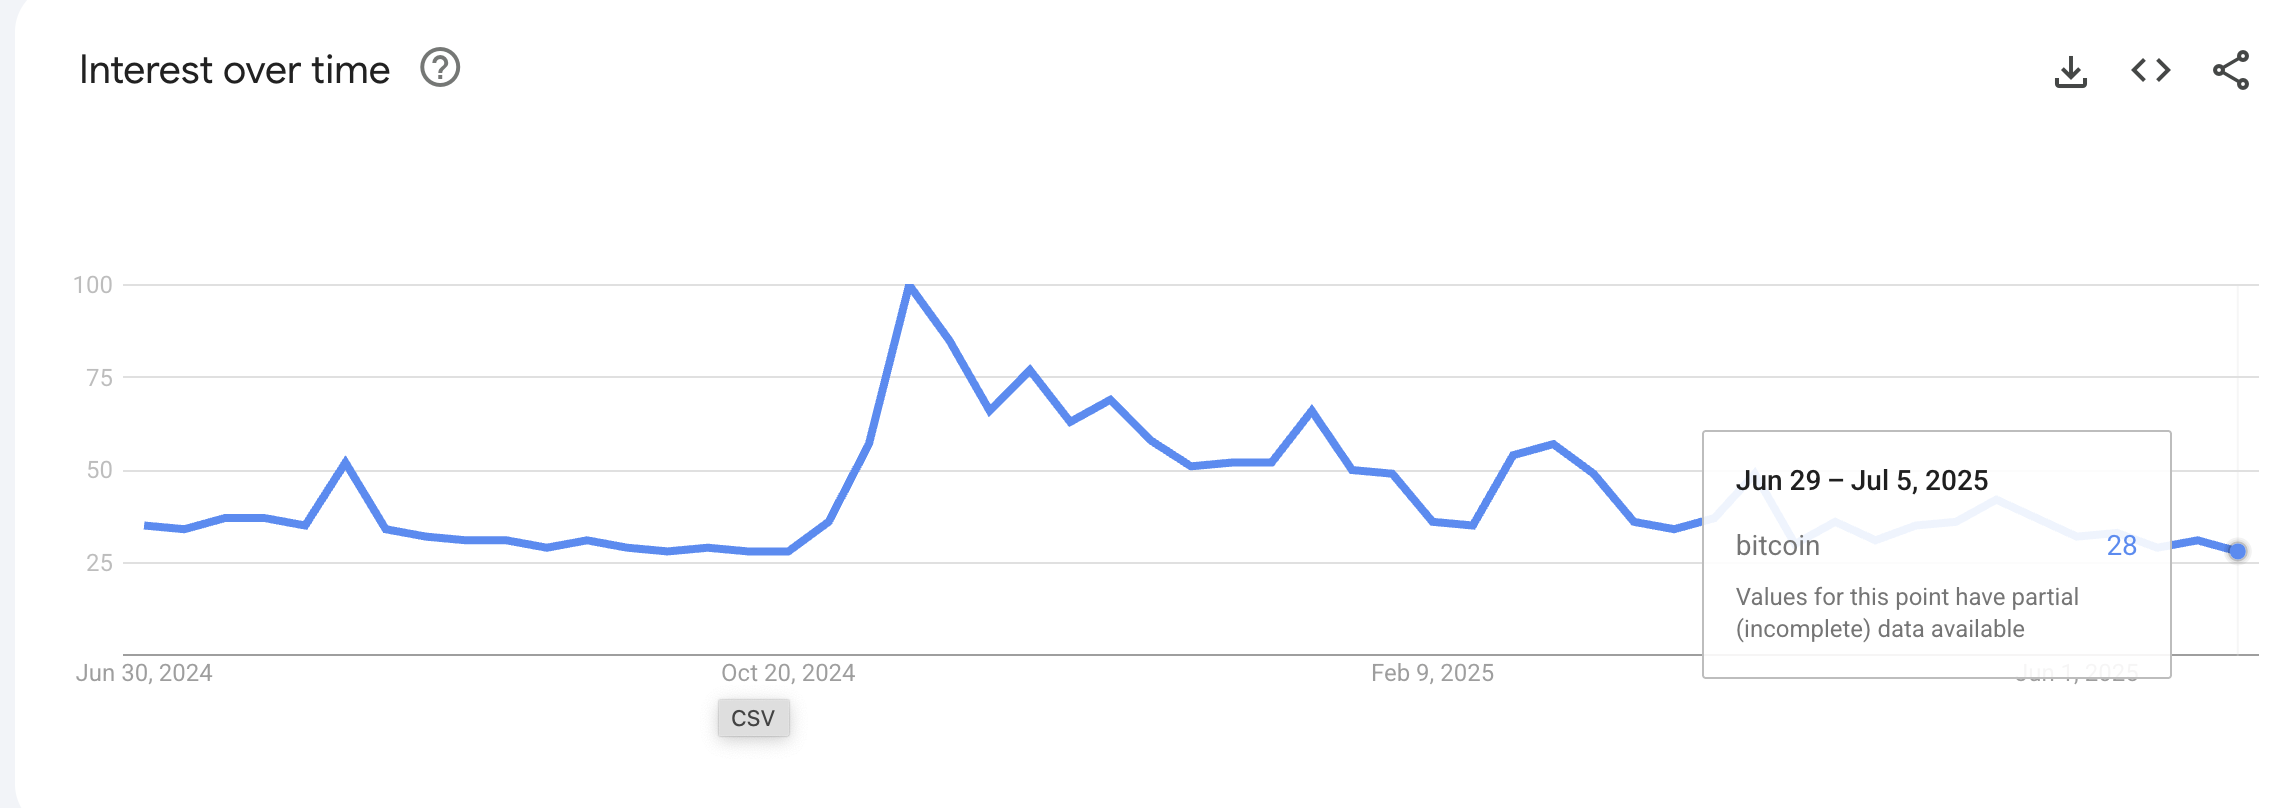
Interest in Bitcoin over time | Source: Google Trends
Notably, the Crypto Fear & Greed Index is moderately bullish, currently standing at 64, according to CryptoRank data. In other words, traders and investors are willing to take more risk. On the other hand, a higher greed figure is often a precursor to major pullbacks, as investors de-risk to take profits.
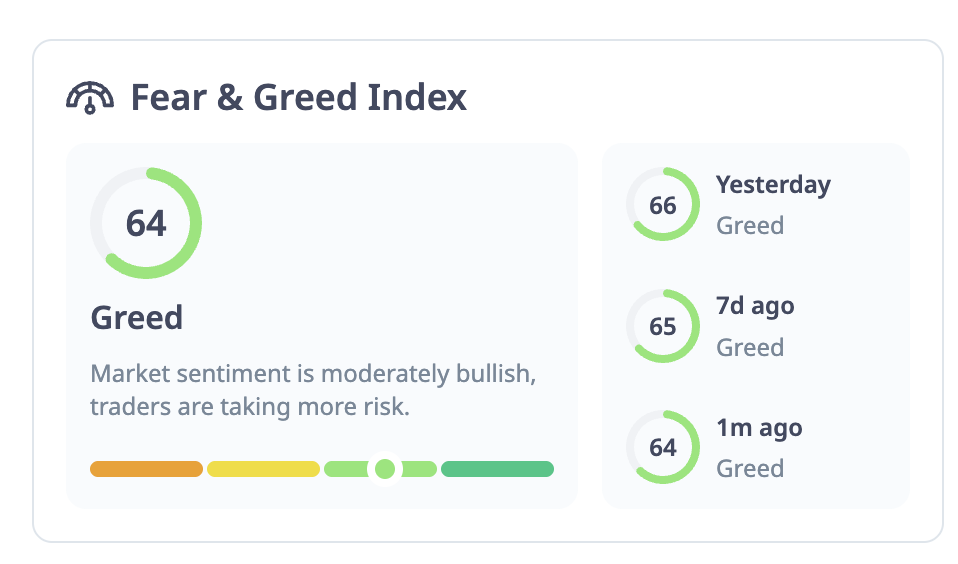
Crypto Fear & Greed Index | Source: CryptoRank
Interest among institutional investors remains steady, with spot Exchange Traded Funds (ETFs) recording approximately $102 million in total daily net inflows on Monday. Last week’s BTC spot ETF volume totaled $2.2 billion, underscoring persistent demand from institutional investors.
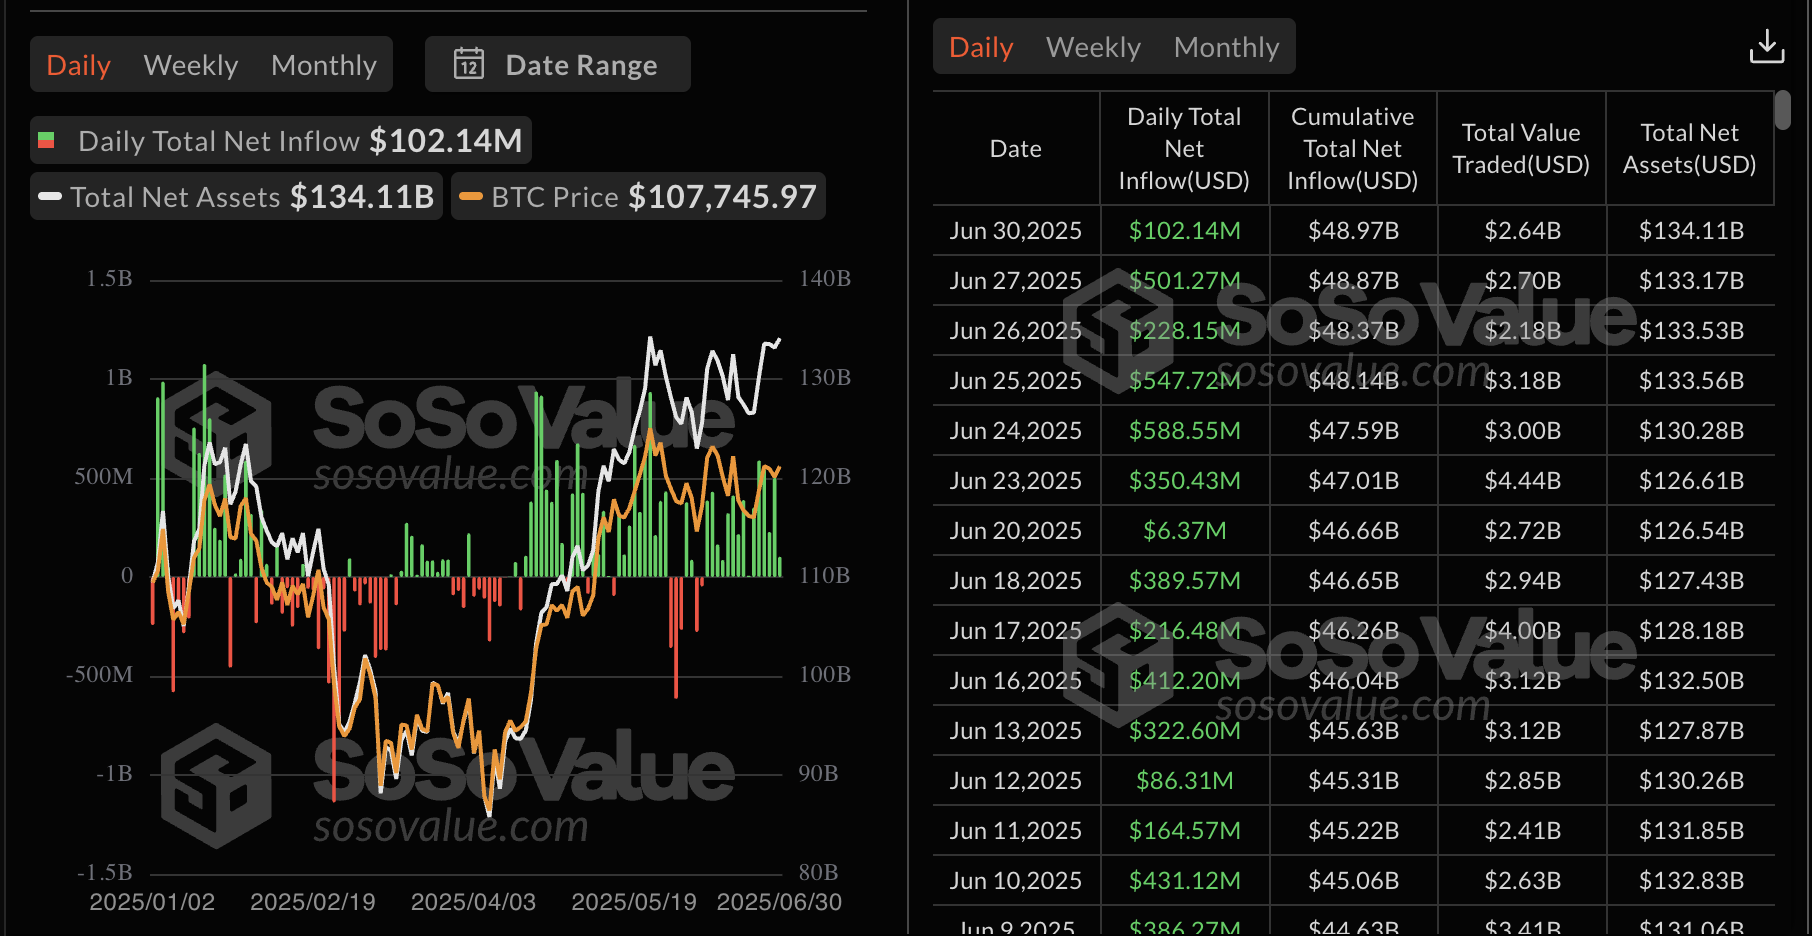
Bitcoin spot ETF data | Source: SoSoValue
As for Ethereum spot ETFs, the total daily net inflow extended the bullish streak on Friday, with almost $32 million streaming in on Monday. The week ending Friday, June 27, saw about $283 million in net inflow volume.
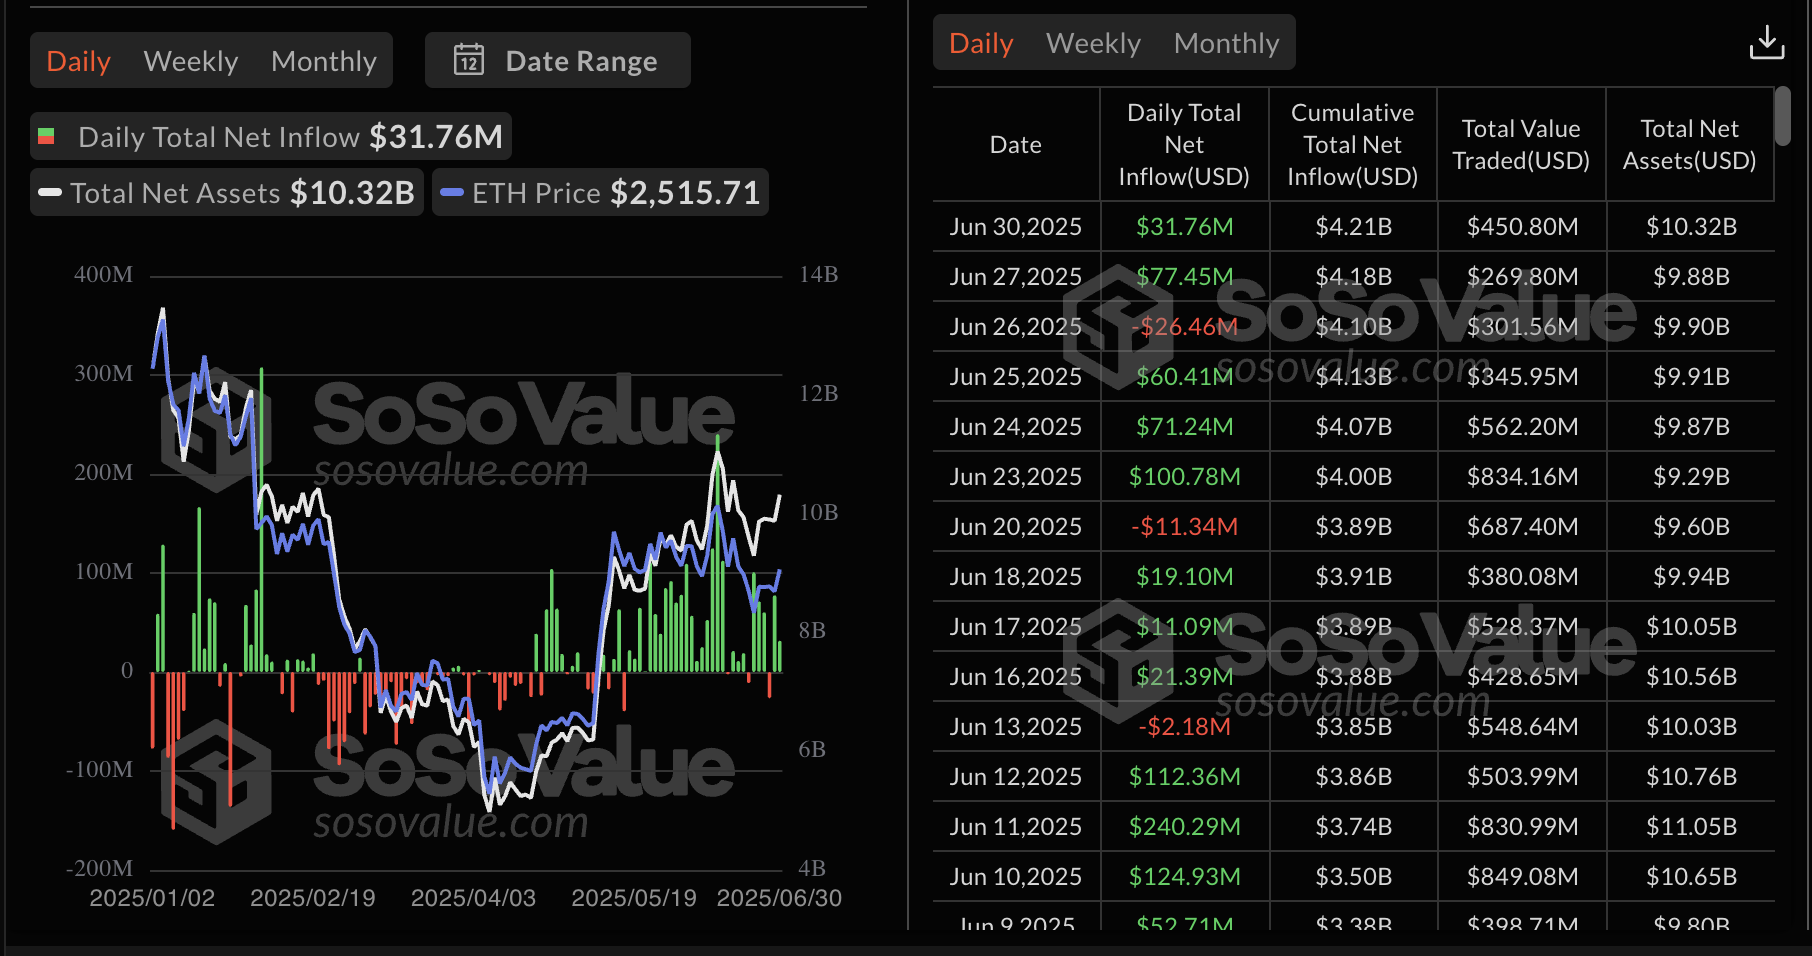
Ethereum spot ETF data | Source: SoSoValue
Chart of the day: Bitcoin extends the down leg
Bitcoin is approaching support at $106,500, tested over the weekend before the uptrend resumed, briefly peaking at around $108,759 on Monday. The path of least resistance is downward, as reflected in the Relative Strength Index (RSI) downtrend, which is slightly below the midline.
Should the immediate support at the $106,500 break, traders would expand their scope to the 50-period Exponential Moving Average (EMA), currently at $106,146, and the 100-period EMA at $105,389 on the 8-hour chart.
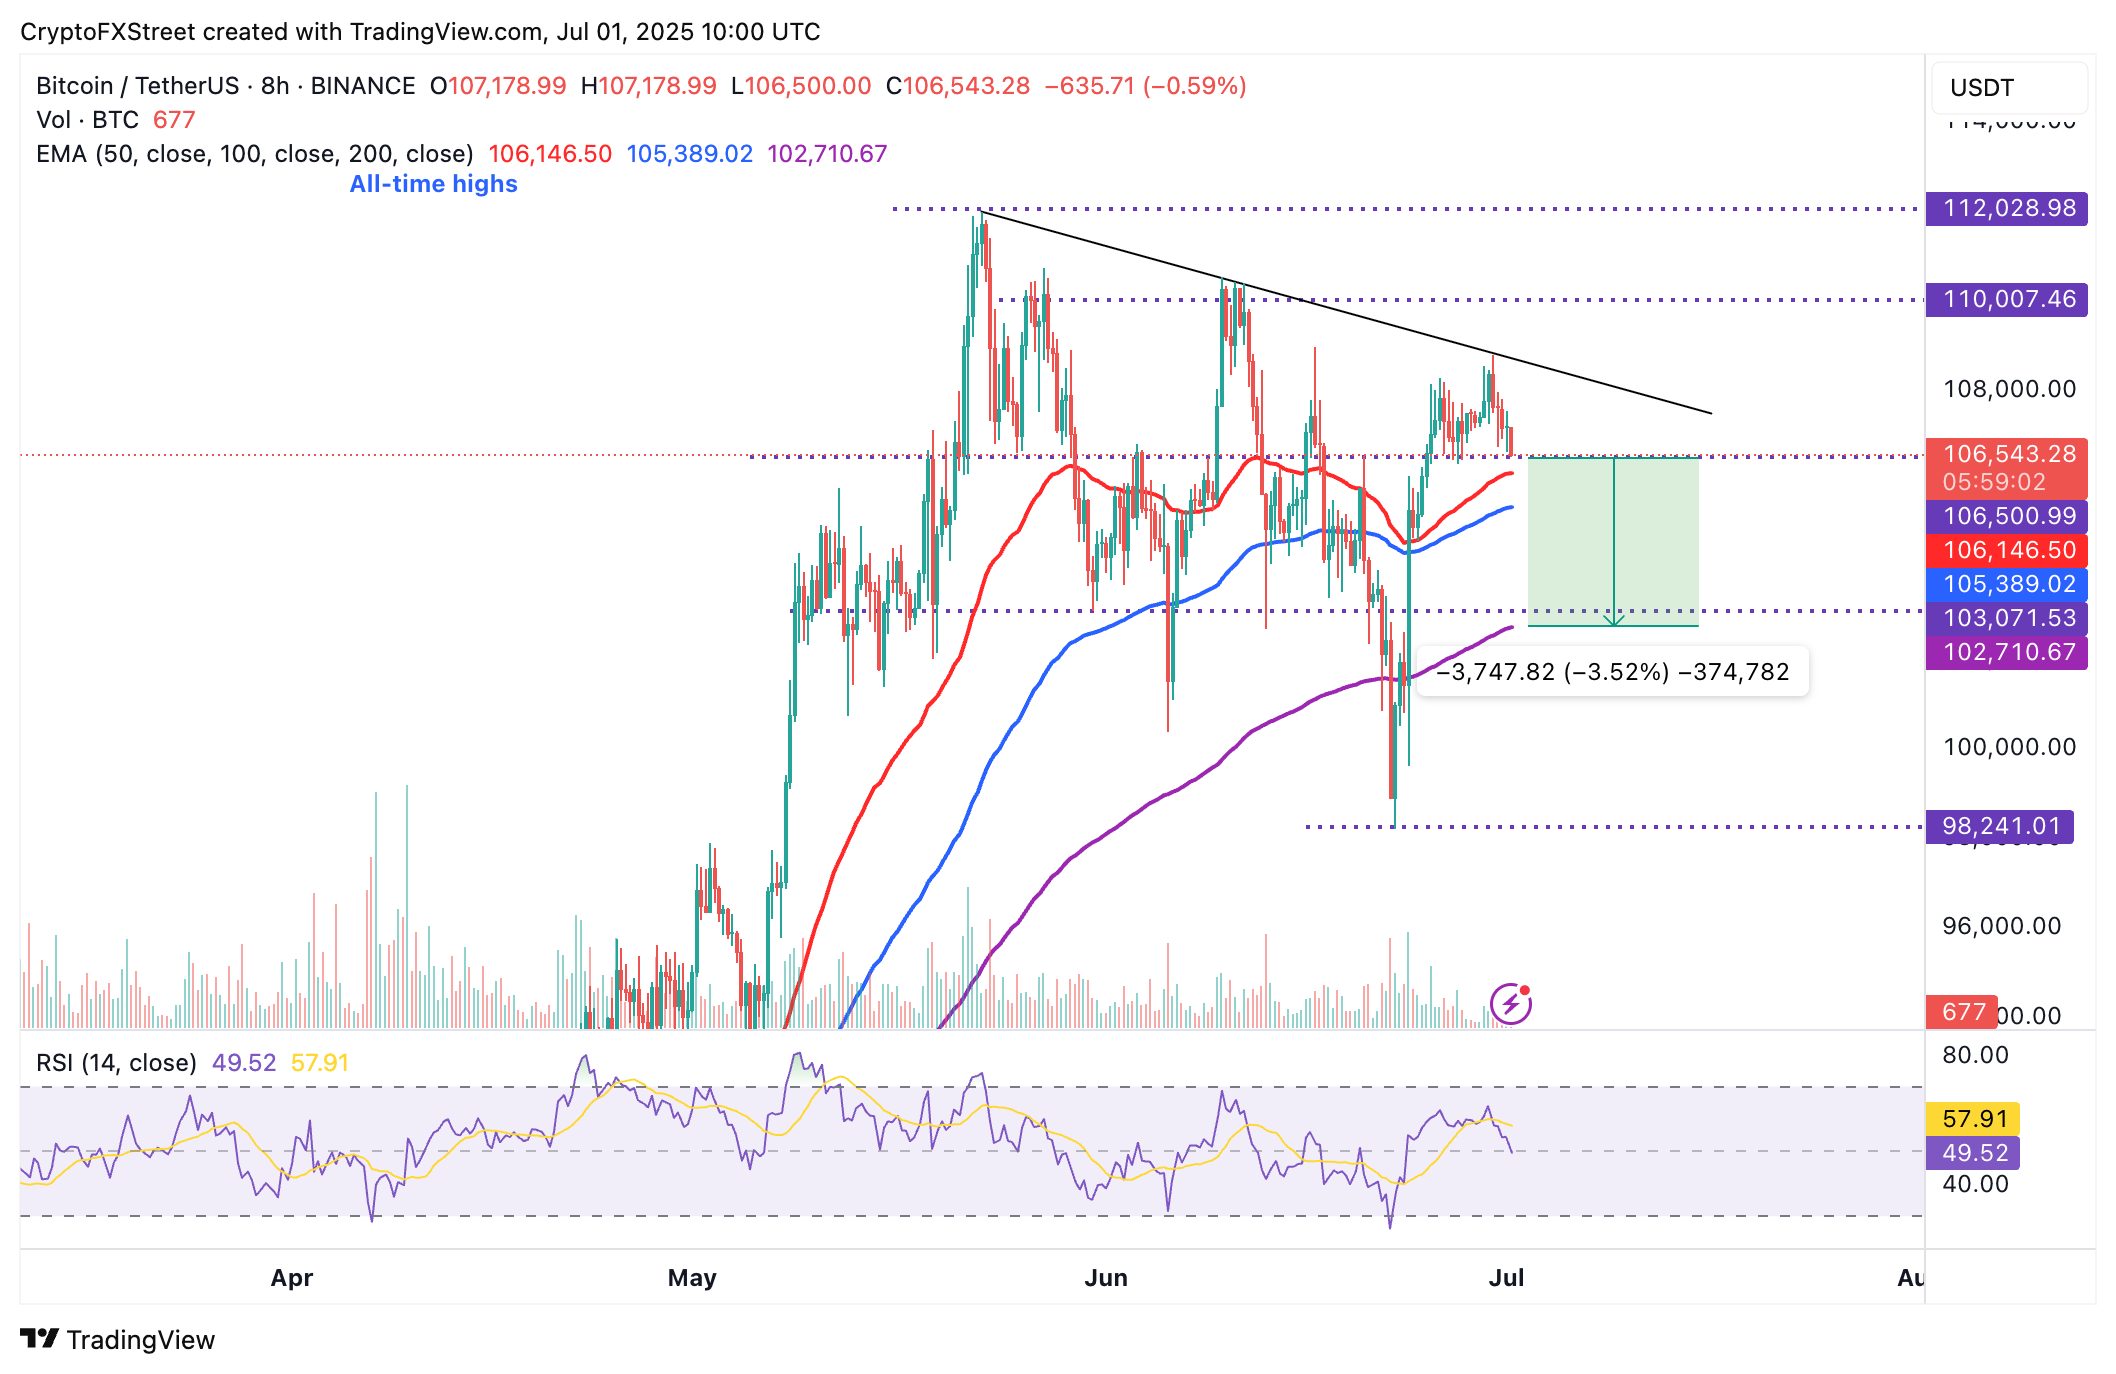
BTC/USDT 8-hour chart
If the pressure mounts, a 3.5% drop would test the support provided by the 200-period EMA at $102,710.
In case the bulls push for an immediate trend reversal from the current price level, key targets would be the Monday high at around $108,759, the round-figure psychological resistance at $110,000, and the all-time high of $111,980, representing a 5% move.
Altcoins update: Ethereum and XRP could extend the decline
Ethereum is struggling to hold onto support provided when the 50-period EMA and the 100-period EMA converge at around $2,464 on the 8-hour chart below. This pullback followed a short-lived upswing on Sunday and Monday, which broke at $2,522.
If market sentiment fails to improve, upcoming sessions could prolong losses, with the ETH price falling toward the 200-period support at $2,398. June’s lowest level, at $2,111, is poised to offer additional support in the event the downtrend accelerates.
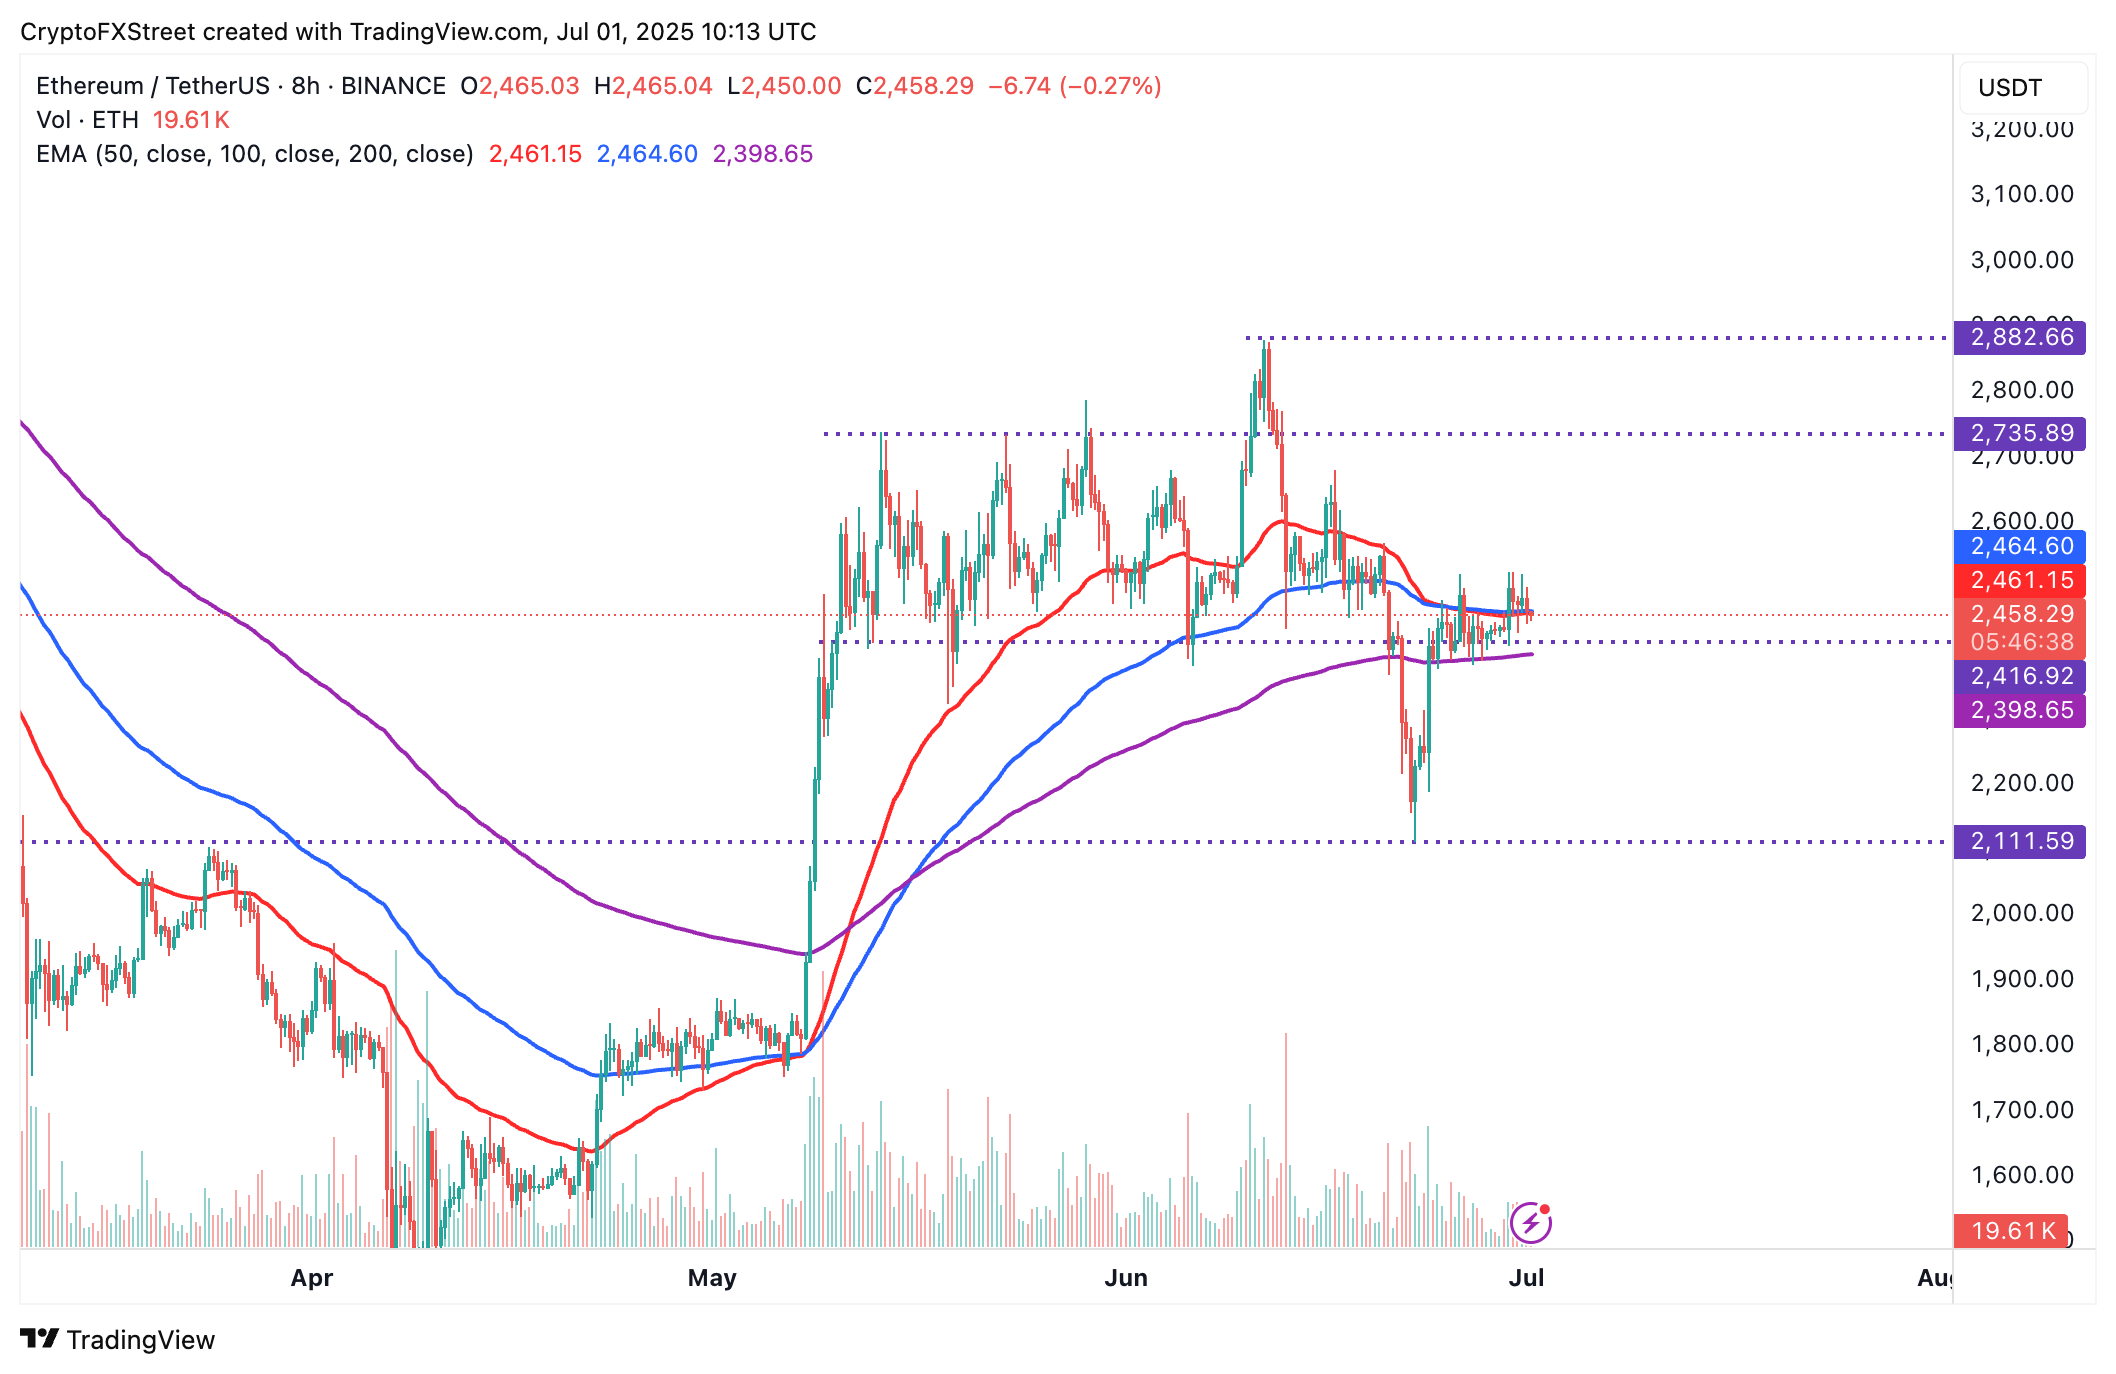
ETH/USDT 8-hour chart
As for Ripple (XRP), the path of least resistance is downward, with its upside capped below the 200-period EMA, currently at $2.21. The decline could retest the 100-period EMA support provided at $2.18, with the 50-period EMA holding slightly below at $2.16.
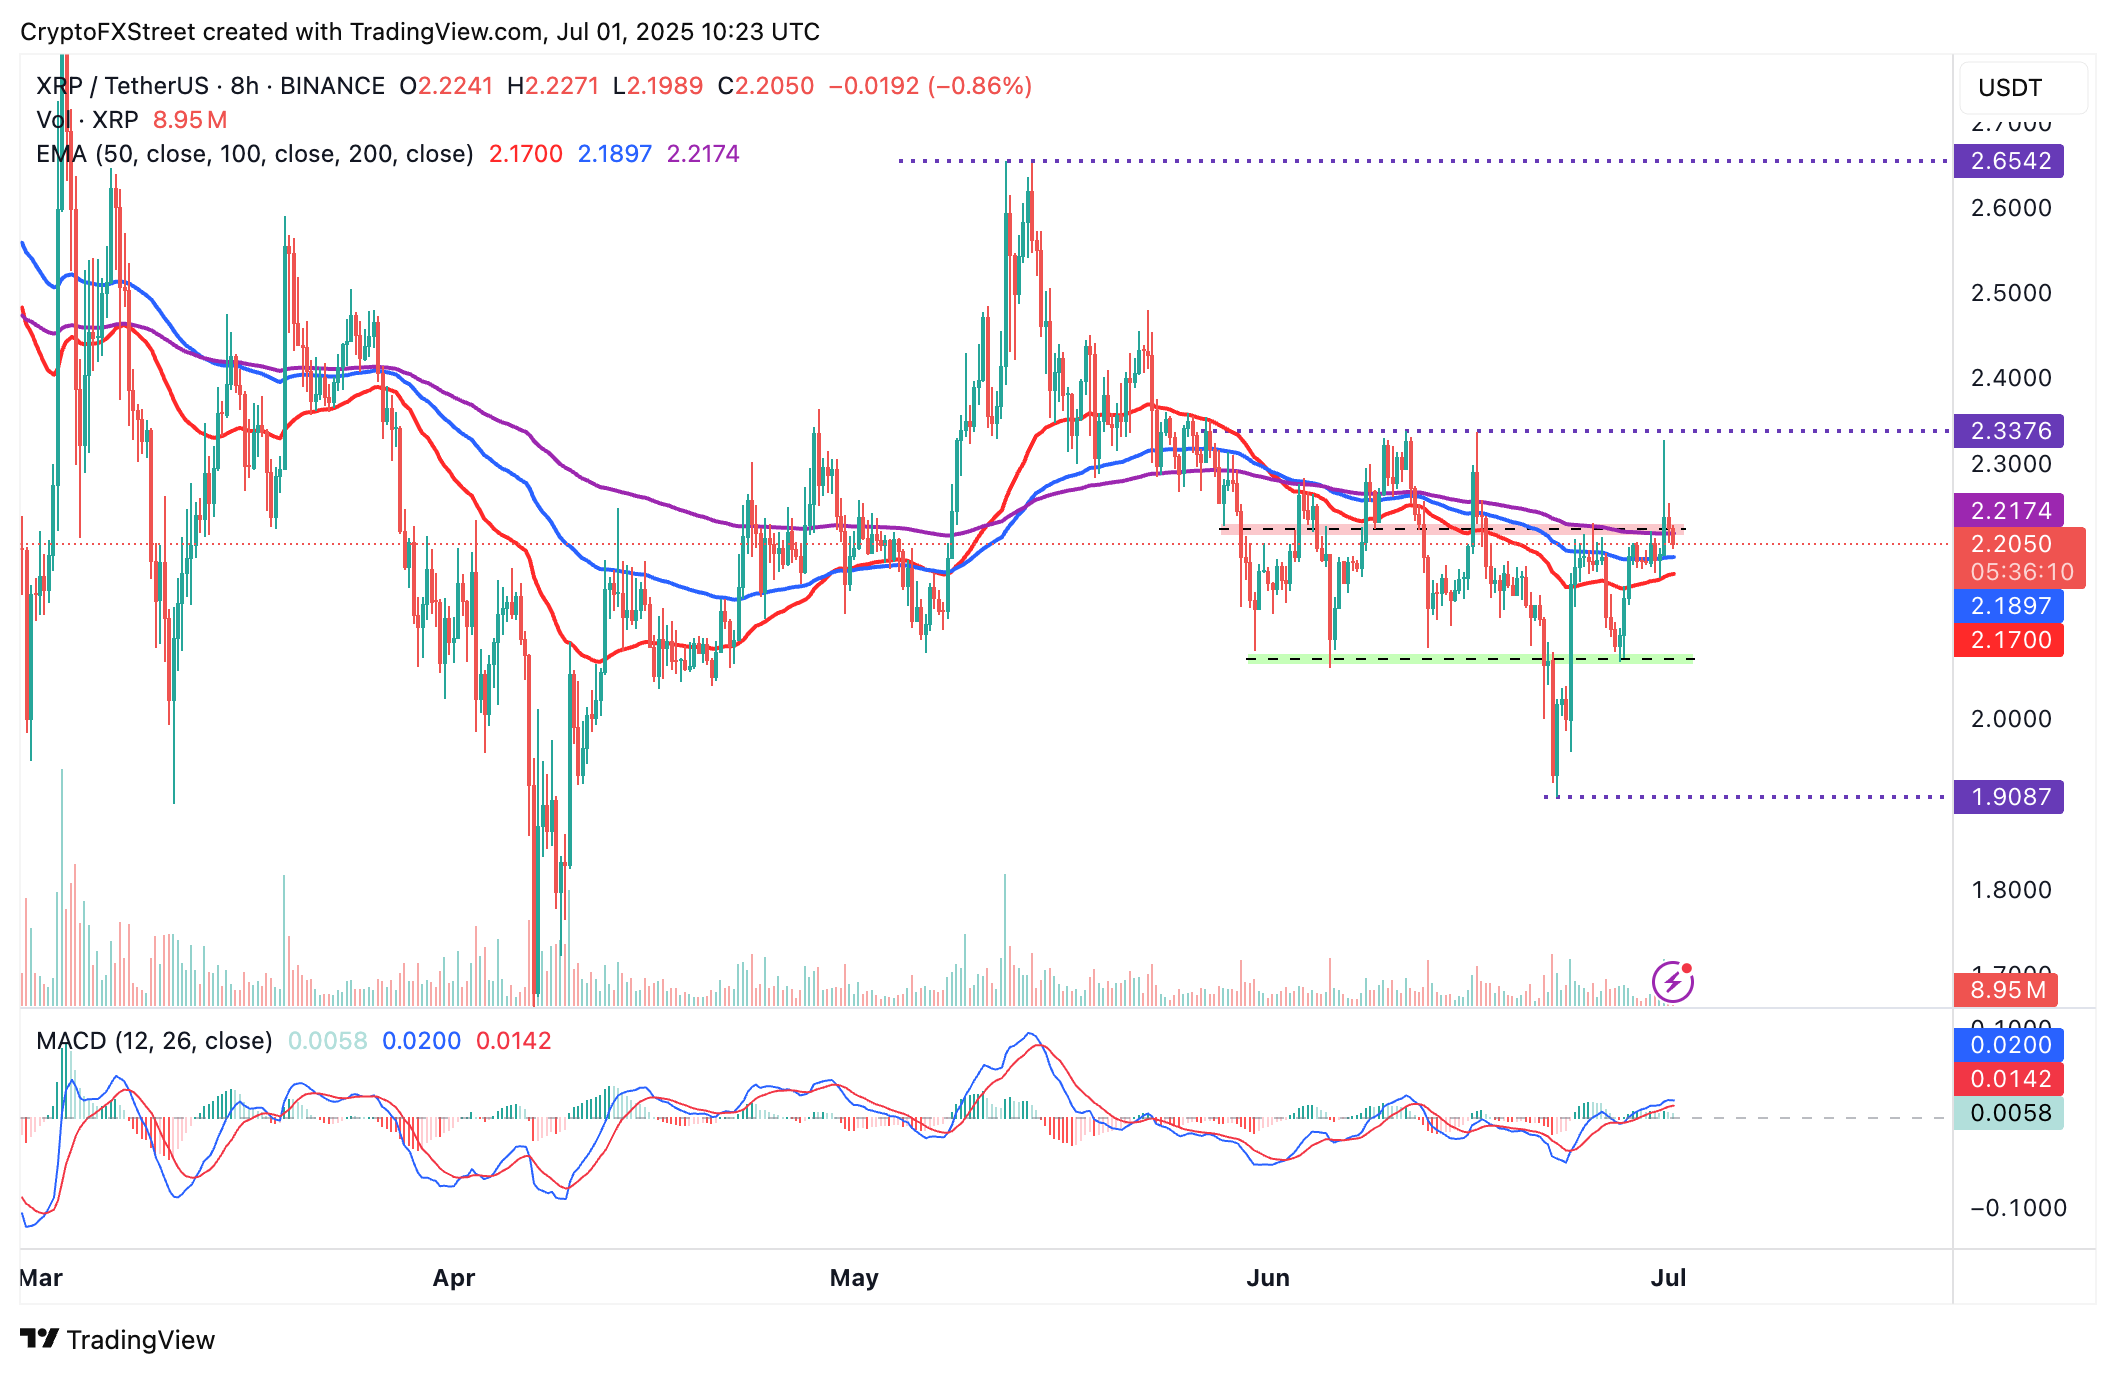
XRP/USDT 8-hour chart
Traders may follow the Moving Average Convergence Divergence (MACD) indicator to ascertain the next direction XRP would take. Currently, the momentum indicator maintains a buy signal triggered on Friday.
However, the indicator shows signs of faltering, with a sell signal likely to manifest with the MACD line in blue crossing beneath the red signal line. Such a signal could trigger losses toward support, which was tested at $2.06 on Friday and $1.90 on June 23.
Cryptocurrency prices FAQs