
- Bitcoin holds steady above $108,000 as bulls eye a breakout amid steady spot ETF inflows.
- Tariff uncertainty grips global markets as China warns the US against reigniting trade tensions.
- Ethereum remains above the $2,500 support level, indicating a slow but steady risk-on sentiment in the broader cryptocurrency market.
- XRP bulls are fighting to break a descending trendline resistance, which has continued to cap price since all-time highs in January.
Cryptocurrency prices show signs of recovery on Tuesday following a volatile session the prior day, driven by tariff uncertainty and trade tensions between the United States (US) and its trading partners. Bitcoin (BTC) is attempting to stabilize above $108,000 after macroeconomic tensions triggered a retracement to $107,429 earlier in the day.
Altcoins, including Ethereum (ETH) and Ripple (XRP), currently hold above critical support levels, which could catalyze the next technical breakout.
Market update: Tariff tensions keep Bitcoin and altcoins on edge
US President Donald Trump’s announced 90-day tariff pause is set to end on Wednesday, with countries yet to strike trade deals likely to receive letters detailing higher rates expected to take effect on August 1. CNN reported on Tuesday that some countries have already been notified of the high tariff rates, which could reach as high as 40%.
China has cautioned the US against reigniting trade tensions by reinstating tariffs on its goods, effective August 1. The Asian economic giant has vowed to retaliate against countries that cut trade deals with the US in a way that undermines Beijing’s interests, according to a Reuters report.
The US and China agreed on a trade framework following negotiations in June, which restored a delicate truce. However, details of the trade agreement remain unclear, leaving traders from both nations in a state of uncertainty.
US President Trump has hinted at an additional 10% tariff on countries allied with the BRICS economic movement.
Data spotlight: Institutional interest remains high with Bitcoin spot ETF inflows
Digital asset products saw $1.04 billion in weekly inflows, according to the CoinShares report, which is released every Monday. Bitcoin-related financial products recorded $790 million in inflows last week, with approximately $226 million going into Ethereum investment assets.
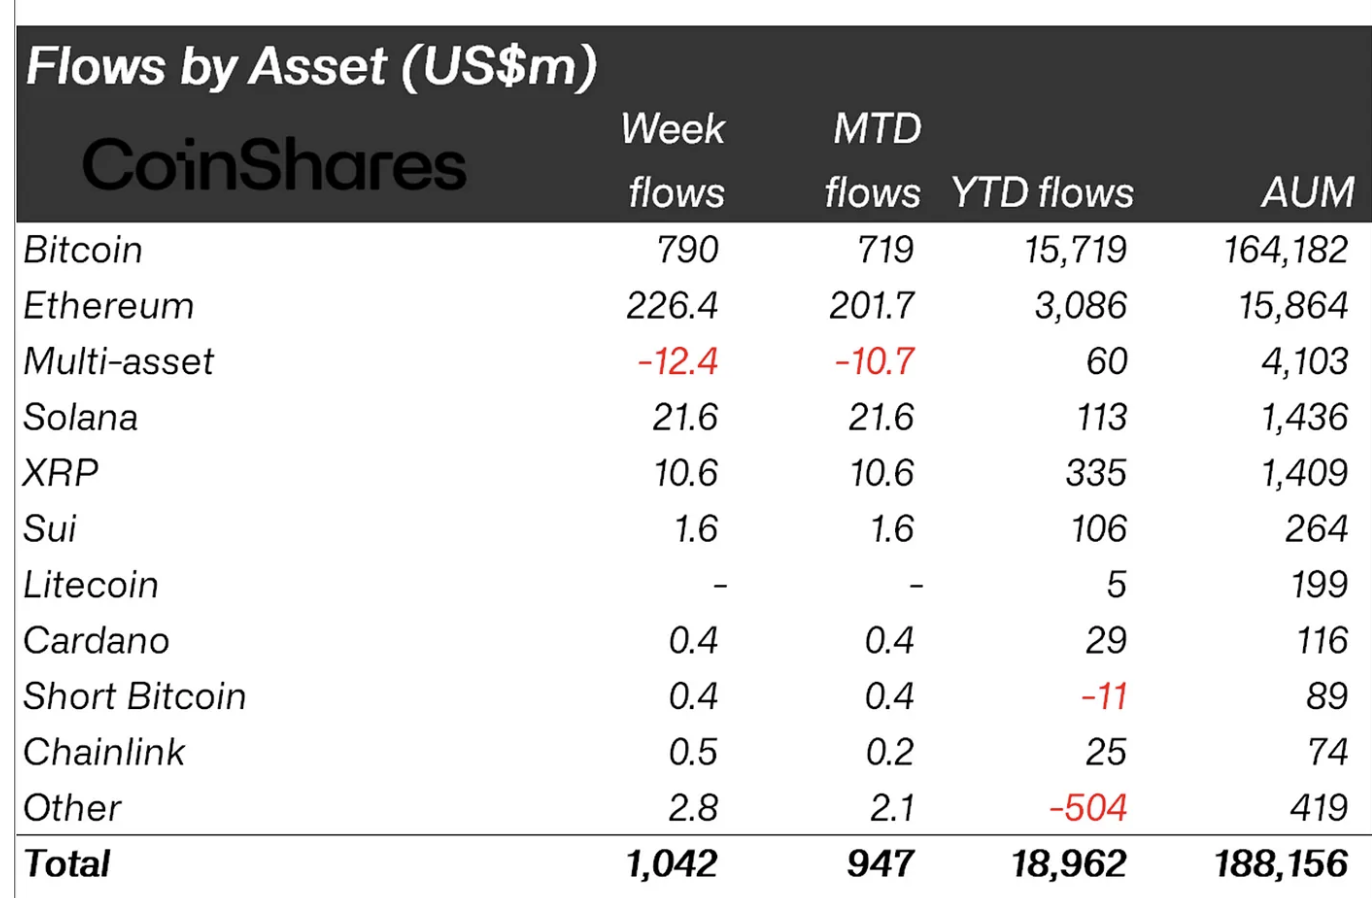
Digital asset products flows stats: Source: CoinShares
Despite the positive flows, CoinShares noted a slowdown from the previous three weeks, which averaged $1.5 billion, citing a cautious approach by investors as the price approaches all-time highs.
“The moderation in inflows suggests that investors are becoming more cautious as Bitcoin approaches its all-time high price levels,” the CoinShares report states.
Bitcoin spot Exchange Traded Funds (ETFs) have maintained positive daily inflows since July 2, posting approximately $217 million in net inflow volume on Monday.
The cumulative total net inflow is nearing the $50 billion mark, but stood at $49.86 billion as of Monday. The total net assets for the 12 spot ETFs licensed in the US are around $136 billion, according to SoSoValue.
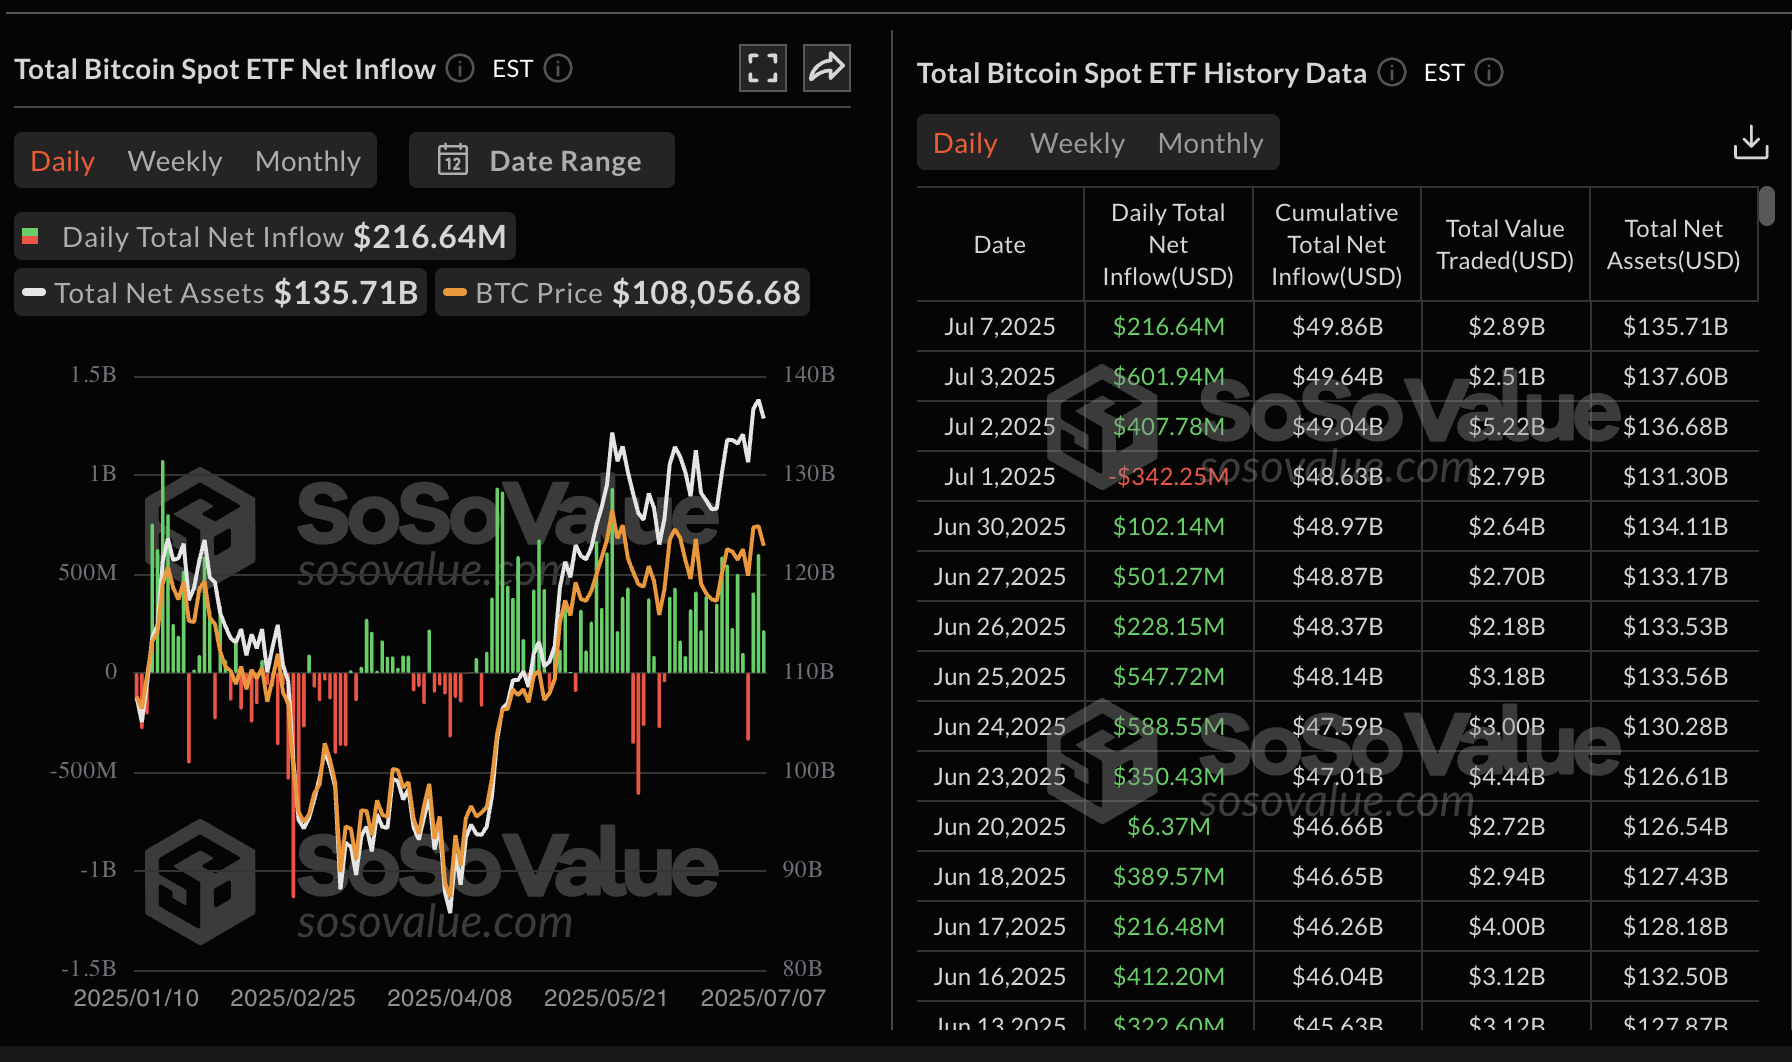
Bitcoin spot ETF data | Source: SoSoValue
Chart of the day: Bitcoin offers mixed technical signals
Bitcoin’s price is trading at around $108,441 at the time of writing as it recovers from intraday lows of $107,429. The largest crypto by market capitalization holds above a recently broken descending trendline.
If the price can stabilize above this level, bulls will have ample time to collect liquidity ahead of another attempt to break the resistance at around $110,527, which capped the price action last week.
Bitcoin also holds significantly above key moving averages, including the 50-day Exponential Moving Average (EMA), currently at $105,259, the 100-day EMA at $101,500 and the 200-day EMA at $95,641. This outlook backs the notion of a stable technical structure, which could predispose Bitcoin to further gains and also serve as tentative support levels in the event of a trend reversal.
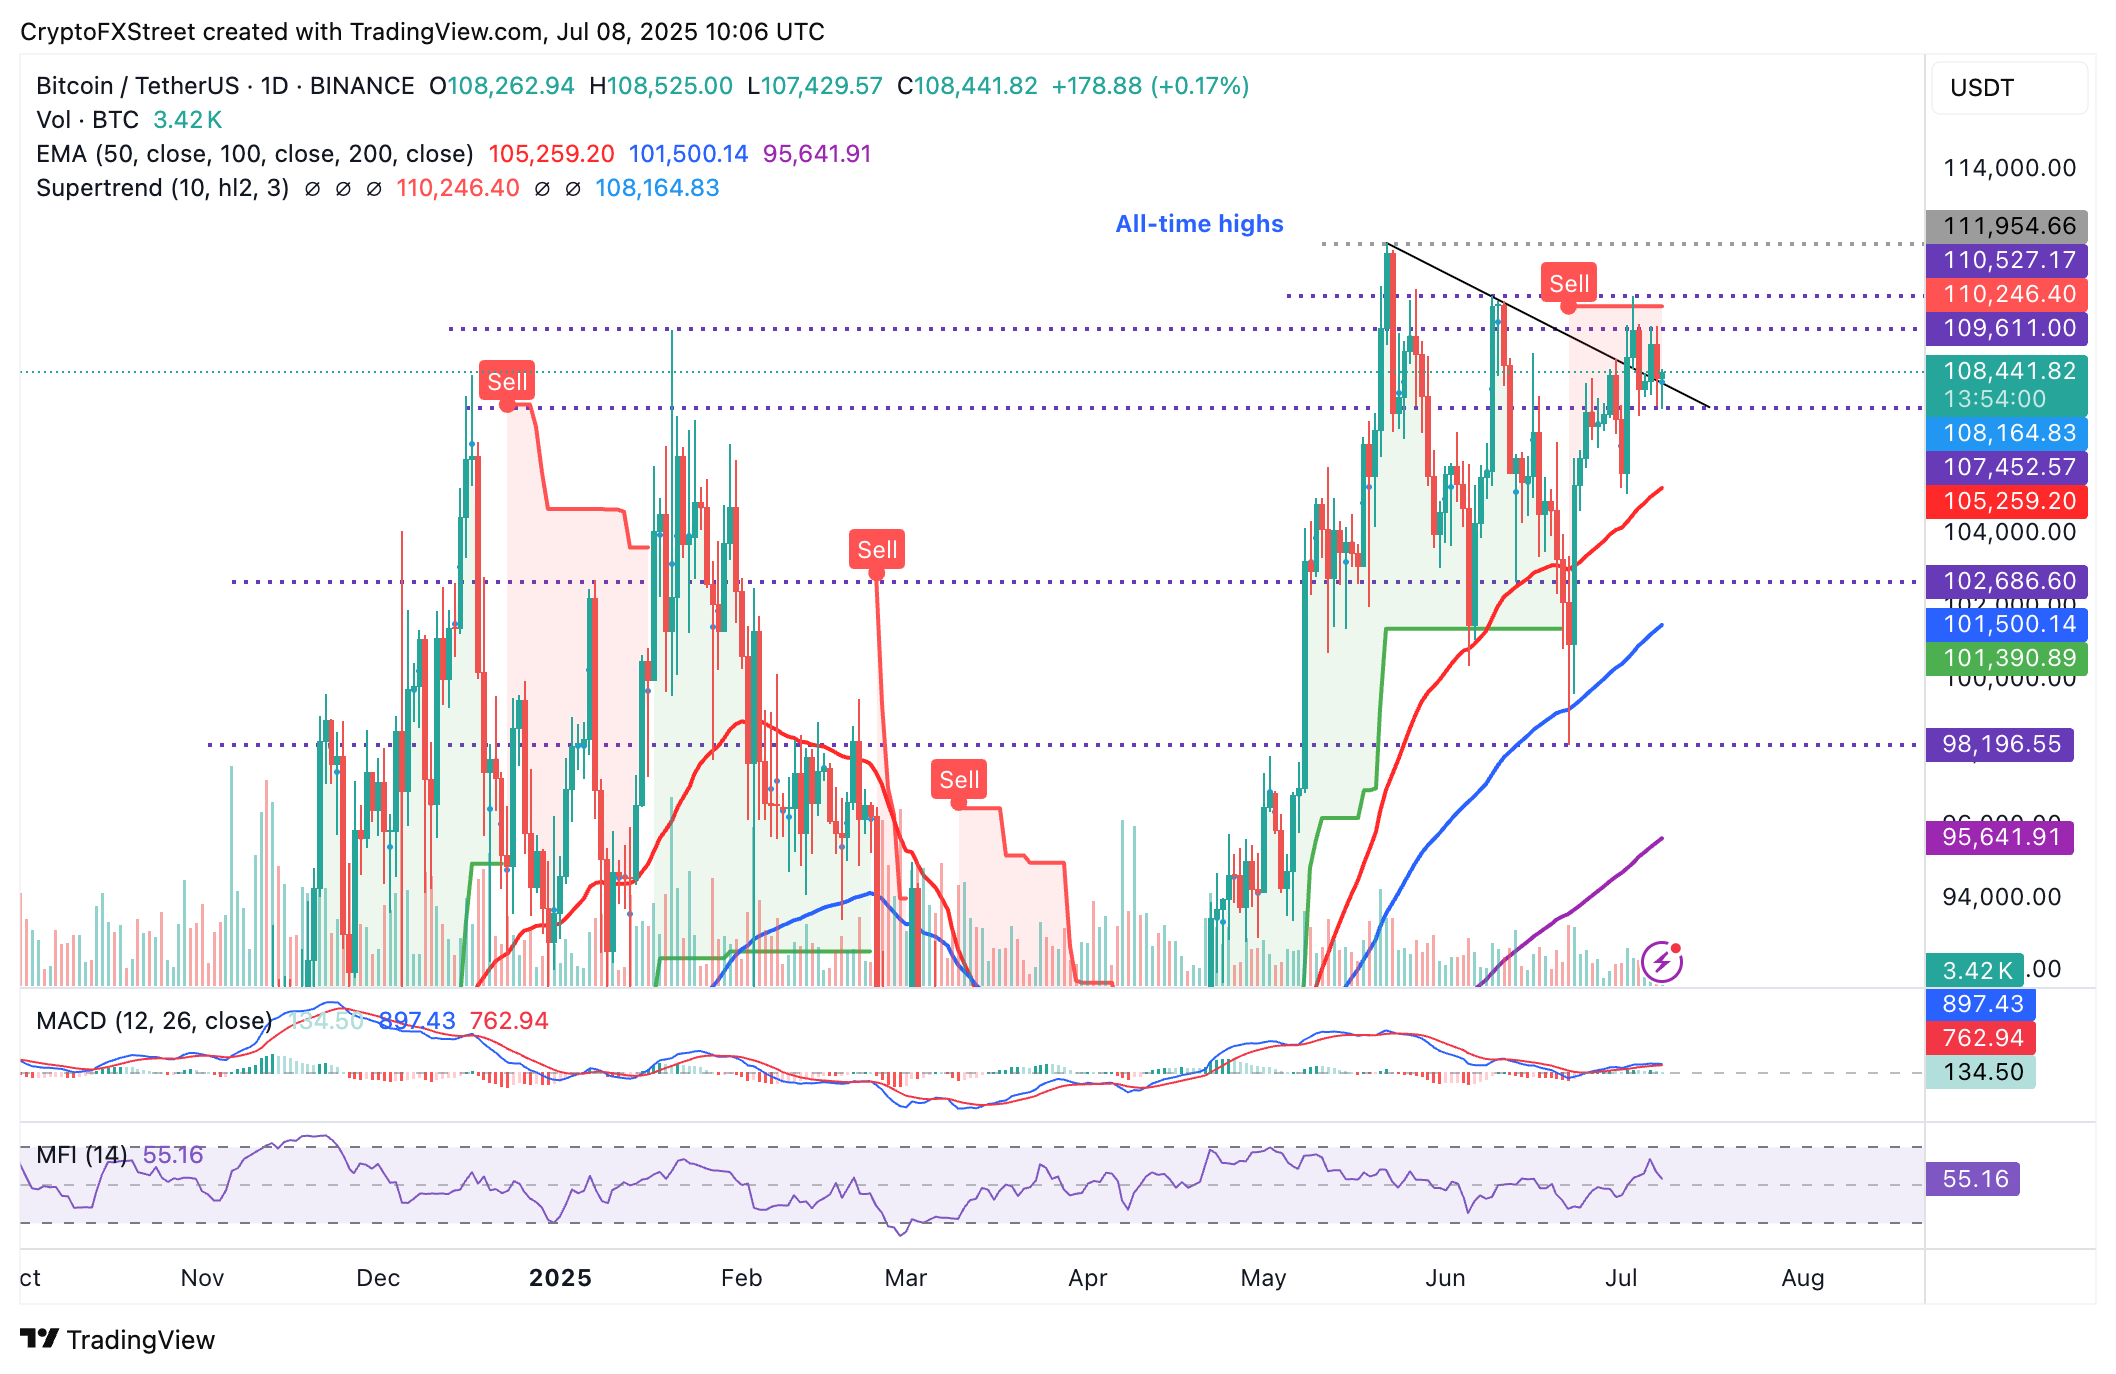
BTC/USDT daily chart
The path of least resistance appears upward based on a slightly bullish bias portrayed by the Moving Average Convergence Divergence (MACD) indicator’s buy signal. Traders tend to seek exposure with the blue MACD line holding above the red signal line.
Still, the downward-trending movement of the Money Flow Index (MFI) at 55 indicates that money is leaving Bitcoin, which could hinder the expected bullish breakout.
Altcoins update: Ethereum, XRP consolidation extends
Ethereum’s price has maintained a bullish outlook, even as it consolidates broadly above the support provided by key moving averages, including the 200-day EMA currently at $2,474, the 50-day EMA at $ 2,458 and the 100-day EMA at $2,402.
The MACD indicator provides a bullish signal, as the blue line remains above the red signal line. Traders should maintain their exposure as long as the MACD indicator remains trending upward, which encourages a risk-on sentiment.
A breakout above the resistance highlighted at $2,633, which was tested on Thursday, could expand the bullish scope toward $2,880, the level that capped the price in June, and the round-figure psychological resistance at $3,000.
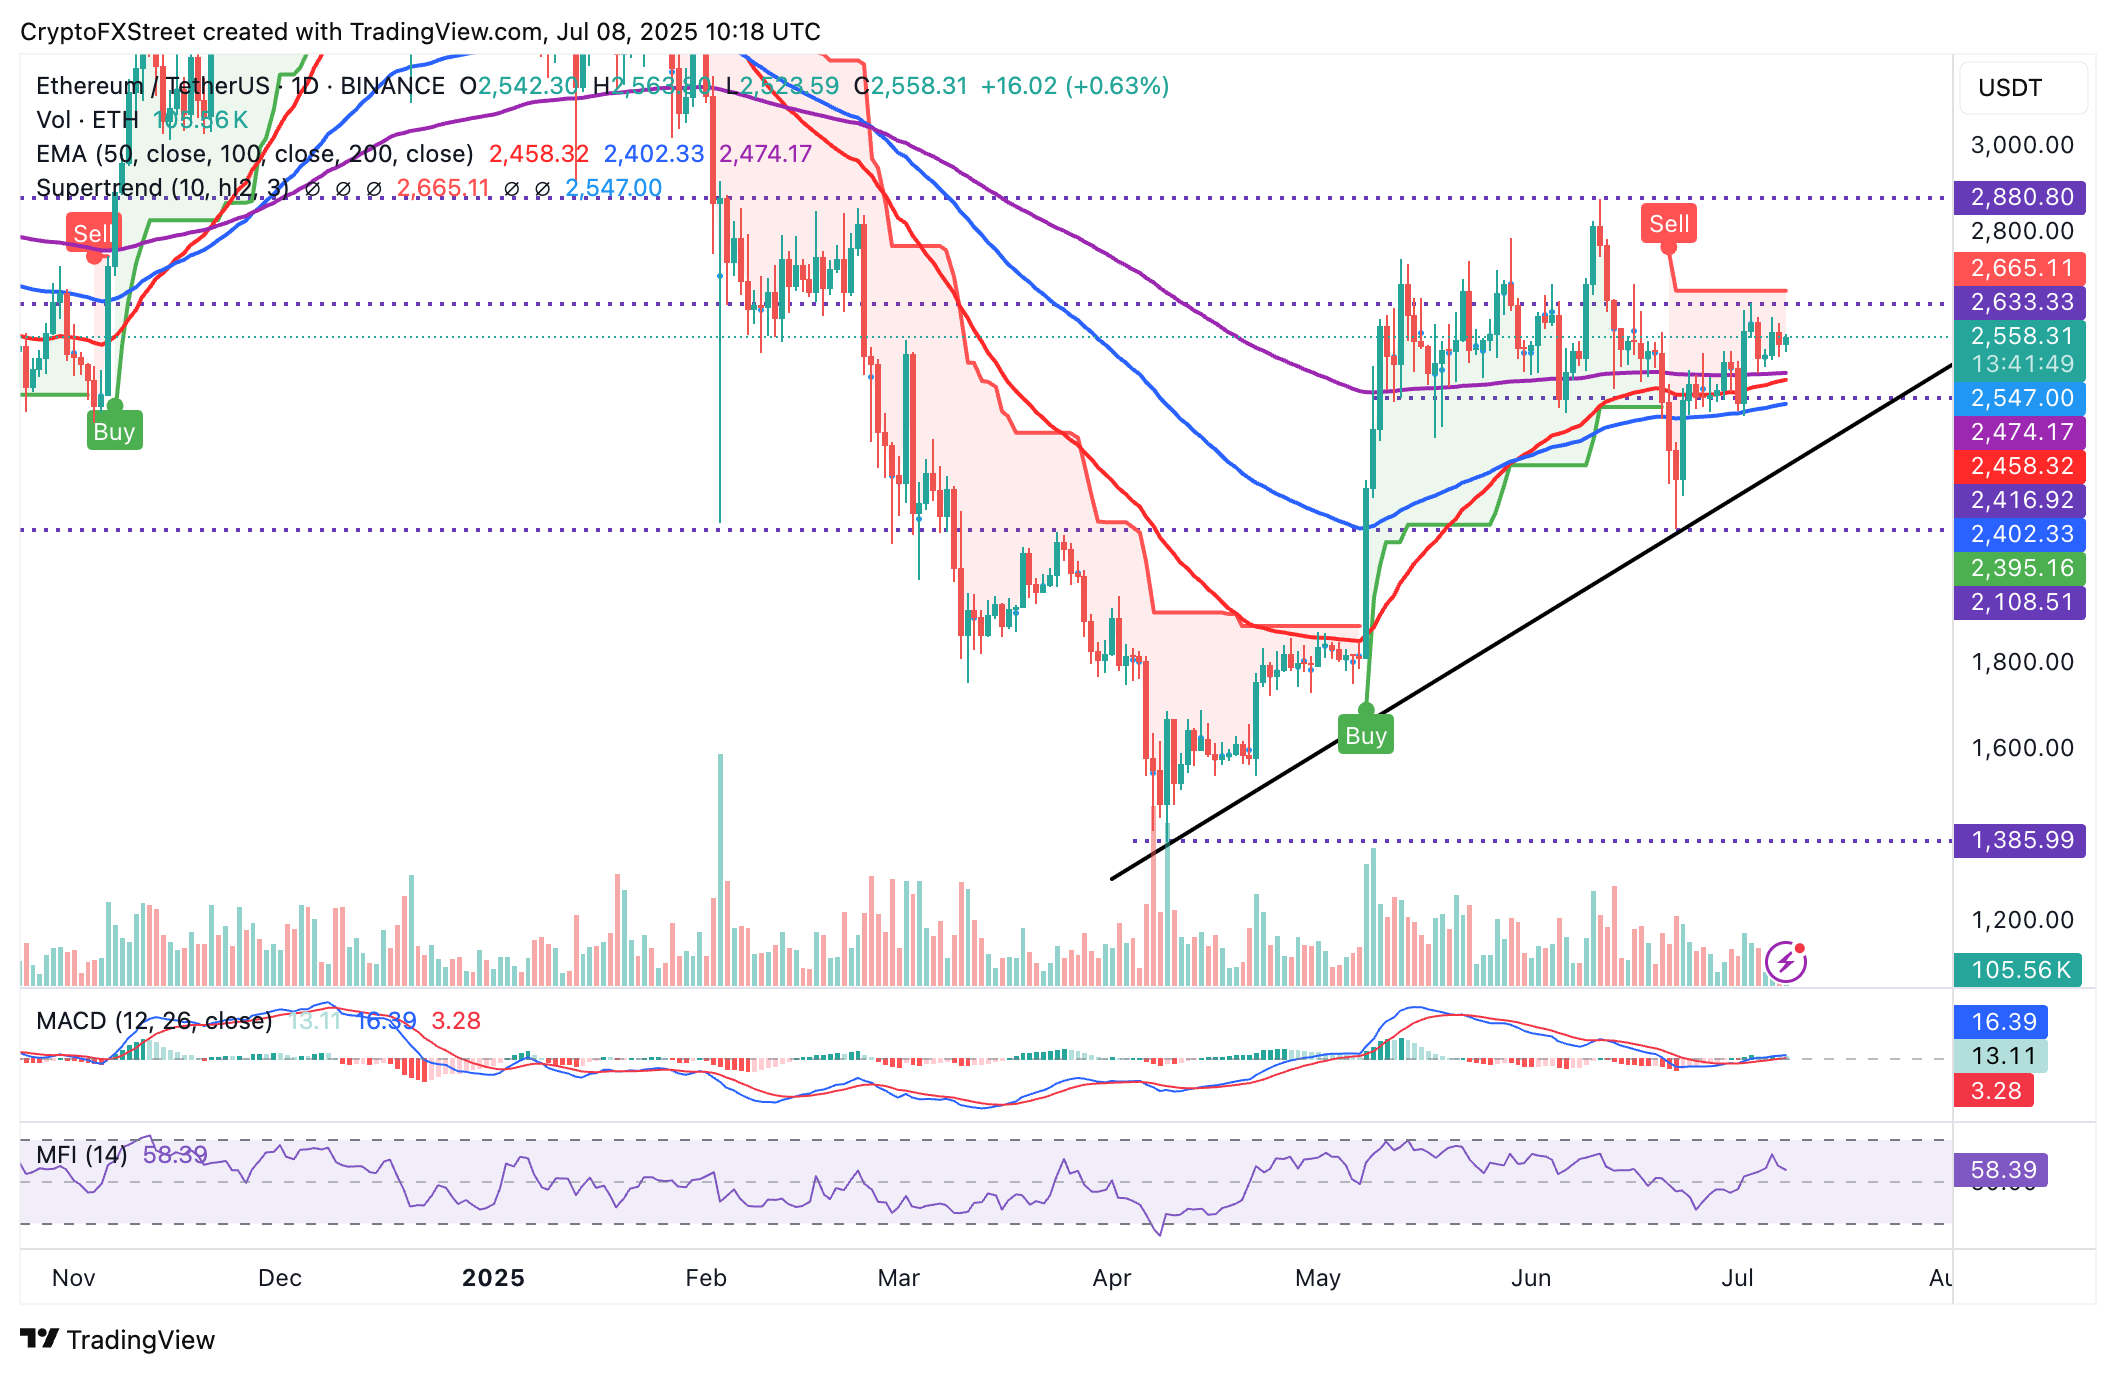
ETH/USDT daily chart
As for XRP, bulls remain in control, with the price hovering at around $2.29. The path of least resistance appears to be upward, with the MACD indicator displaying a buy signal since Saturday. Support is provided by the 100-day EMA, currently at $2.22, and the 50-day EMA, which is slightly below at $2.21.
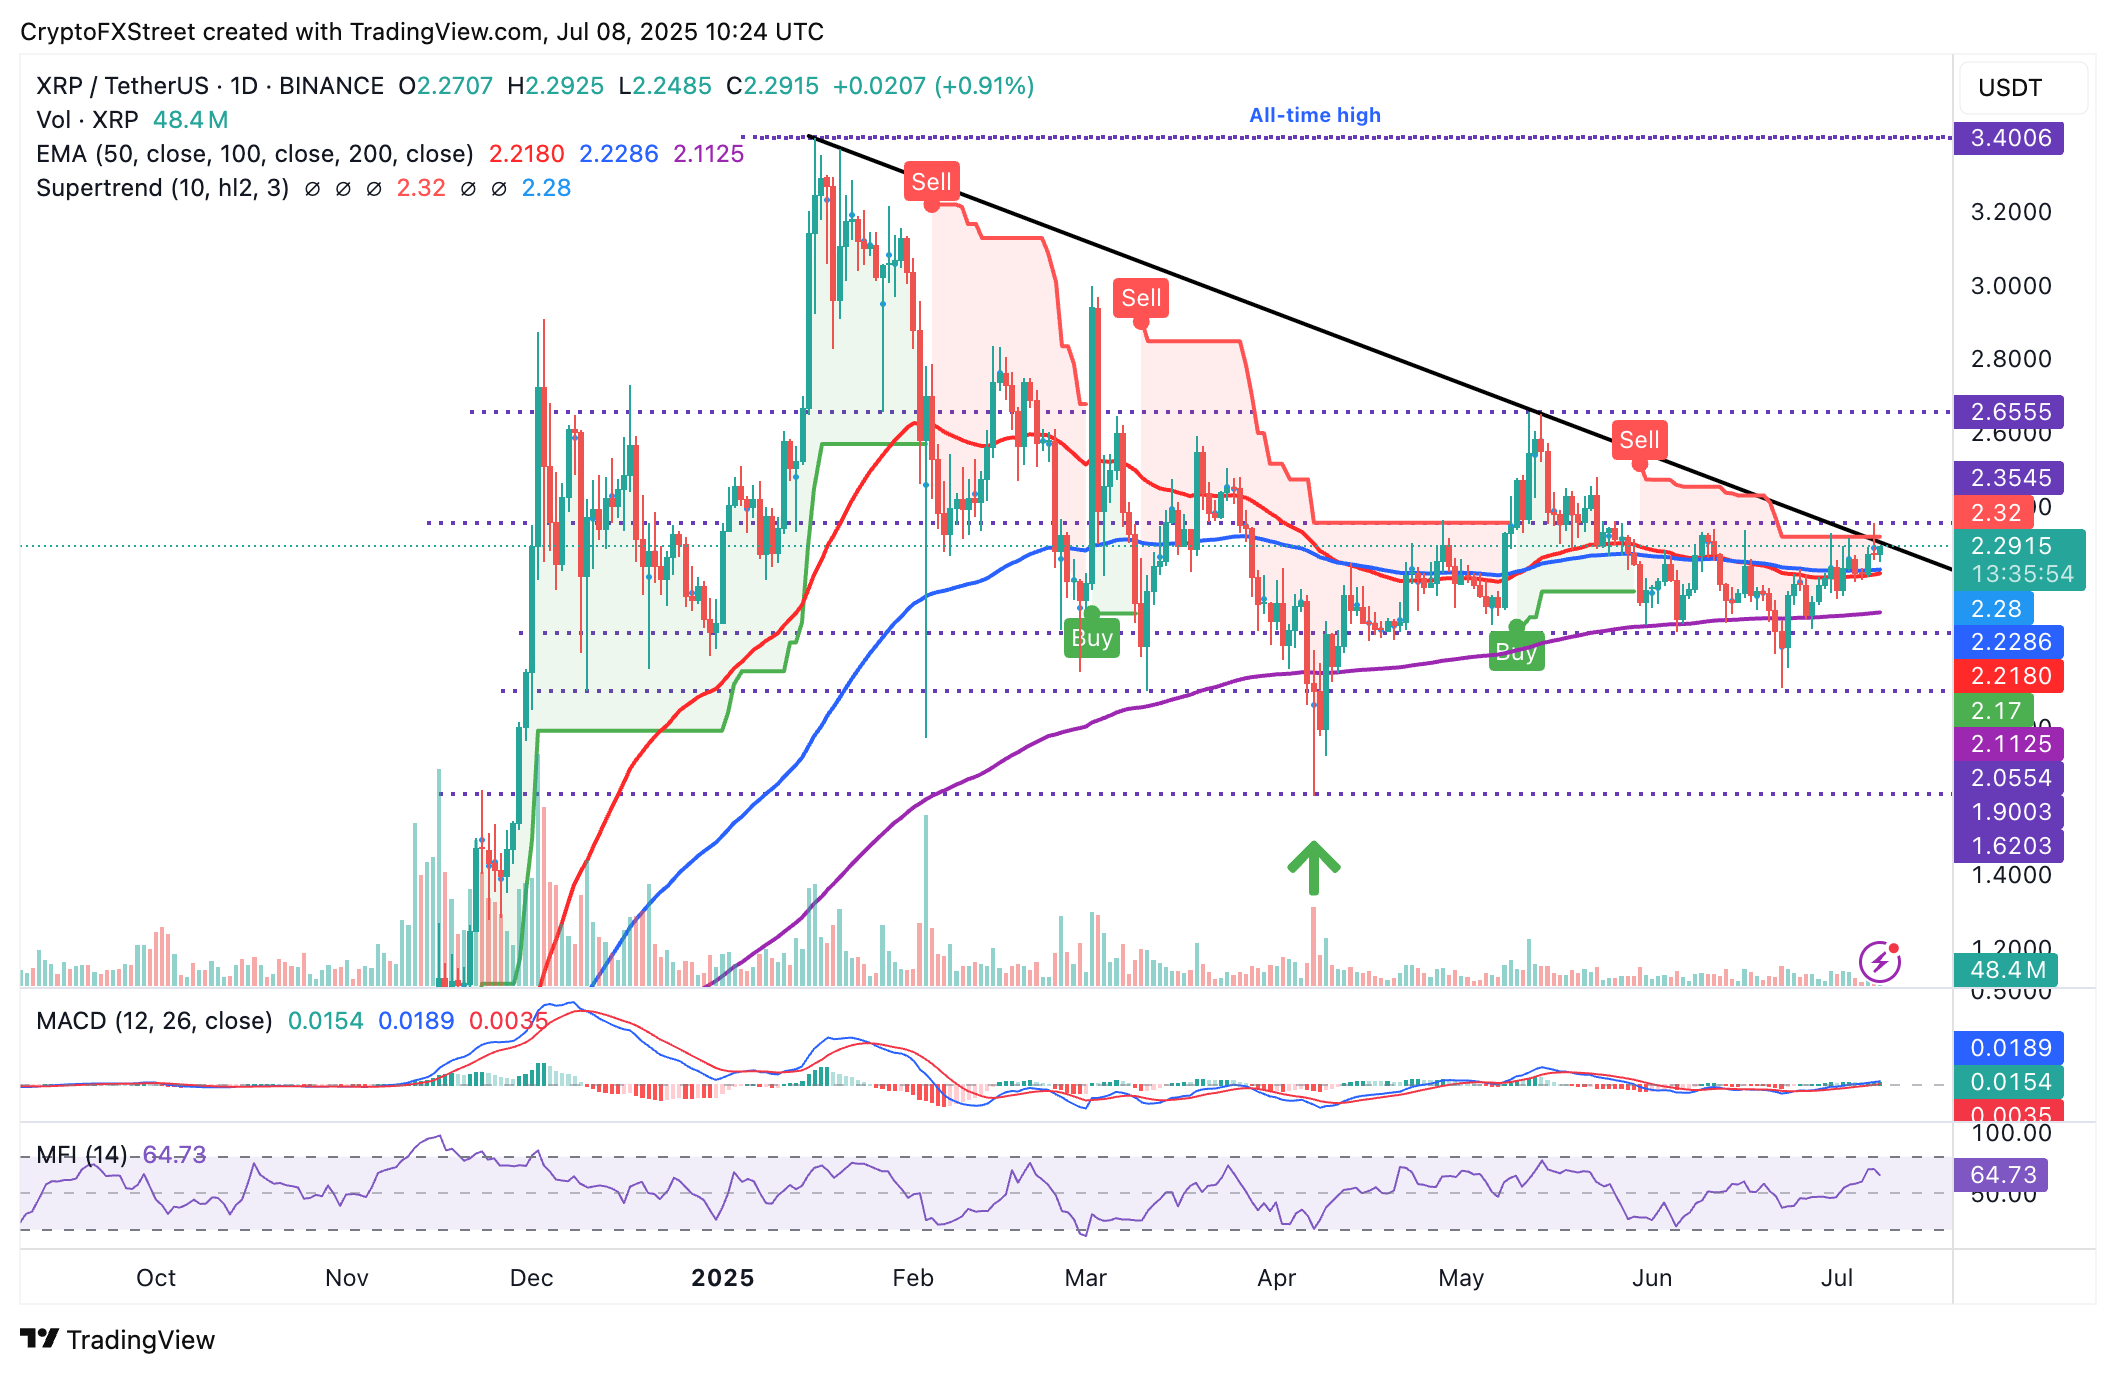
XRP/USDT daily chart
The descending trendline, which has been maintained since XRP reached its all-time high of $3.40 in January, is the biggest bottleneck that bulls are facing.
A break above this critical level could catalyze the uptrend as traders expand the bullish scope to $2.65, the highest peak in May, and the round-number target at $3.00.